
AUC-ROC Curve- it’s importance in Machine Learning
In Machine Learning, performance measurement is avital task. We need to evaluate the model and validate how good or bad it is, so we can then choose to implement it or not. There the AUC-ROC curve comes in.
The AUC-ROC curve tells us visualize how well our machine learning classifier is carrying out.It is one of the most significant evaluation metrics for examining any classification model’s performance. It is also called as AUROC (Area Under the Receiver Operating Characteristics).
Let’s define the terms used in AUC and ROC Curve.
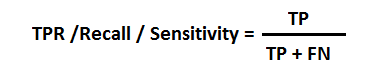
TPR (True Positive Rate) / Recall /Sensitivity
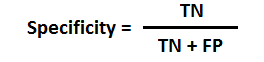
Specificity
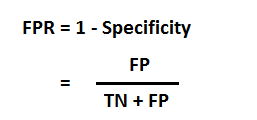
FPR
What is AUC – ROC Curve?
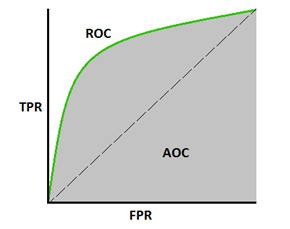
The Area Under the Curve (AUC) is the measure of the capability of a classifier to distinguish between classes.
The Receiver Operator Characteristic (ROC) curve is a performance measurement for binary classification problems and is a probability curve that plots the TPR against FPR at various threshold values. It separates the ‘signal’ from the ‘noise’.
The higher the AUC, the better the performance of the model is at predicting 0s as 0s and 1s as 1s.
Understanding the performance of the model
A model that has good measure of separability has AUC near to 1. On the other hand, a model with AUC near to 0 has a worst measure of separability. It means the model is predicting 0s as 1s and 1s as 0s. and the model with AUC 0.5 has no class separation capacity.
Let’s interpret above statements.
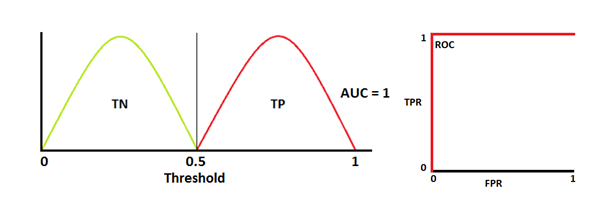
Note: Red distribution curve represents positive class (patients with disease) and green distribution curve represents negative class(patients with no disease).
The model has an ideal measure of separability two curves don’t overlap at all. It is able to distinguish perfectly between positive class and negative class.
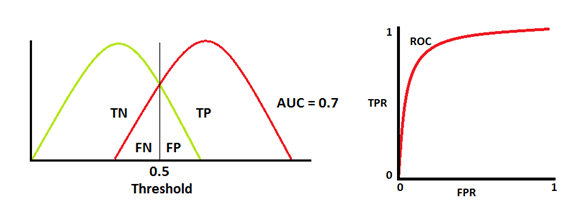
When two distributions overlap with each other, there is has type 1 and type 2 error. We can minimize or maximize them, depending upon the threshold. When AUC is 0.7, it means that the model has 70% chance to distinguish between positive class and negative class.
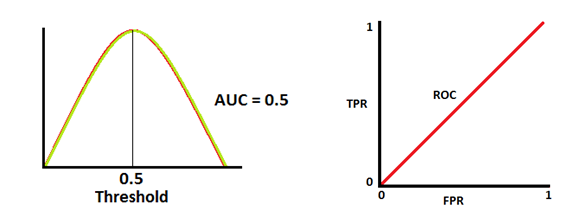
This is the worst case where AUC is approximately 0.5, model cannot distinguish between positive class and negative class.
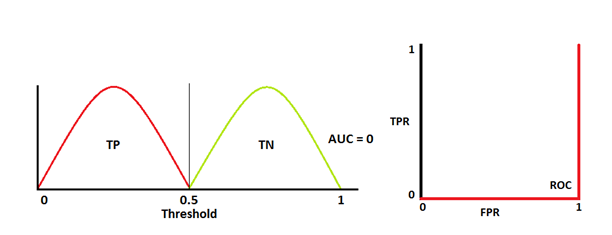
When AUC is near to 0, model is reciprocating the classes i.e.,the model is predicting negative class as a positive class and vice versa.
Relation between Sensitivity, Specificity, FPR and Threshold.
Sensitivity is inversely proportional to Specificity. This means increase in Sensitivity, decreases Specificity and vice versa.
Sensitivity⬆️, Specificity⬇️ and Sensitivity⬇️, Specificity⬆️
When threshold is decreased, we get more positive values thus it increases the sensitivity and decreasing the specificity.
Similarly, when threshold is increased, we get more negative values thus we get higher specificity and lower sensitivity.
As FPR is 1 – specificity. Therefore, when we increase TPR, FPR also increases and vice versa.
TPR⬆️, FPR⬆️ and TPR⬇️, FPR⬇️
AUC ROC curve for multi-class model
For a multi-class model,N number of AUC ROC Curves are plotted for N number classes using One vs ALL methodology. So, for instance, If you have three classes namely A, B and C, you can have one ROC for A classified against B and C, another ROC for B classified against A and C, and a third one of C classified against B and A.
I hope this article is useful in understanding how powerful the AUC-ROC curve metric in measuring the performance of a classifier.