
Build a Pivot Table using Pandas in Python
The Pandas library provides a function called pivot_table that summarizes feature values in a well-ordered two-dimensional table.
Let’s create a Pivot Table in Python using Pandas
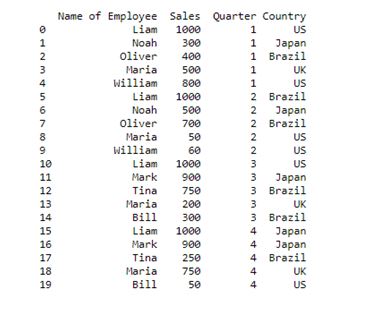
Consider a dataframe as shown below:
Code:
import pandas as pd
employees = {'Name of Employee': ['Liam','Noah','Oliver','Maria','William','Liam','Noah','Oliver','Maria','William','Liam','Mark','Tina','Maria','Bill','Liam','Mark','Tina','Maria','Bill'],
     'Sales': [1000,300,400,500,800,1000,500,700,50,60,1000,900,750,200,300,1000,900,250,750,50],
     'Quarter': [1,1,1,1,1,2,2,2,2,2,3,3,3,3,3,4,4,4,4,4],
     'Country': ['US','Japan','Brazil','UK','US','Brazil','Japan','Brazil','US','US','US','Japan','Brazil','UK','Brazil','Japan','Japan','Brazil','UK','US']
     }

df = pd.DataFrame(employees, columns= ['Name of Employee','Sales','Quarter','Country'])
print (df)
Output:
Now with DataFrame ready, you can be able to pivot your data.
In this article we will discuss on how to determine the:
- Total sales per employee
- Total sales by country
- Sales by both employee and country
- Maximum individual sale by country
- Mean, median and minimum sales by country
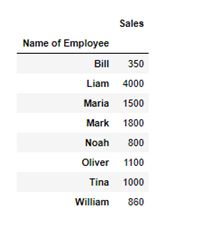
Scenario 1: Total sales per employee
You can calculate the sum of the sales per employee by using the aggfunc=’sum’ operation.
]
Code:
pivot = df.pivot_table(index=['Name of Employee'], values=['Sales'], aggfunc='sum')
pivot
Output:
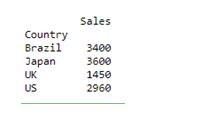
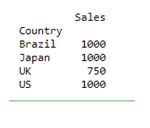
Scenario 2: Total sales by country
Now you can also see how to group the total sales by the county.
For this you need to aggregate the results by the field name ‘Country’, rather than the ‘Name of Employee’.
Following is the code in Python:
Code:
pivot = df.pivot_table(index=['Country'], values=['Sales'], aggfunc='sum')
print (pivot)
Output:
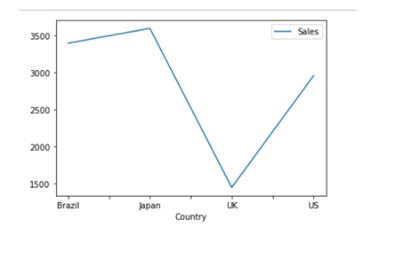
If you want to plot these results, you need to import matplotlib into the code:
Code:
import matplotlib.pyplot as plt
import pandas as pd
employees = {'Name of Employee': ['Liam','Noah','Oliver','Maria','William','Liam','Noah','Oliver','Maria','William','Liam','Mark','Tina','Maria','Bill','Liam','Mark','Tina','Maria','Bill'],
      'Sales': [1000,300,400,500,800,1000,500,700,50,60,1000,900,750,200,300,1000,900,250,750,50],
      'Quarter': [1,1,1,1,1,2,2,2,2,2,3,3,3,3,3,4,4,4,4,4],
      'Country': ['US','Japan','Brazil','UK','US','Brazil','Japan','Brazil','US','US','US','Japan','Brazil','UK','Brazil','Japan','Japan','Brazil','UK','US']
            }
df = pd.DataFrame(employees, columns= ['Name of Employee','Sales','Quarter','Country'])

pivot = df.pivot_table(index=['Country'], values=['Sales'], aggfunc='sum').plot()

plt.show()
Output:
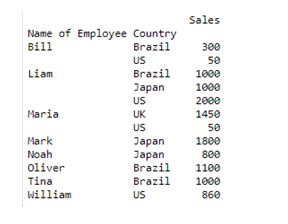
Scenario 3: Sales by both employee and country
You can aggregate the results by more than one field as well.
For instance, you may use the following two fields to get the sales by both the:
- Name of Employee; and
- Country
Code:
pivot = df.pivot_table(index=['Name of Employee','Country'], values=['Sales'], aggfunc='sum')
print (pivot)
Output:
Scenario 4: Maximum individual sale by country
Till now, you used the sum operation i.e., aggfunc=’sum’ to group the results, but you are not restricted to that operation.
You can determine the maximum individual sale by county using the aggfunc=’max’
Code:
pivot = df.pivot_table(index=['Country'], values=['Sales'], aggfunc='max')
print (pivot)
Output:
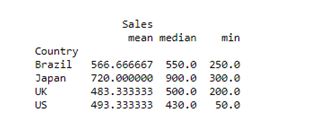
Scenario 5: To compute Mean, median and minimum sales by country
You can even use multiple operations within the aggfunc argument. For instance, to compute the mean, median and minimum sales by country, you may use the following code.
Code:
pivot = df.pivot_table(index=['Country'], values=['Sales'], aggfunc={'median','mean','min'} )
print (pivot)
Output:
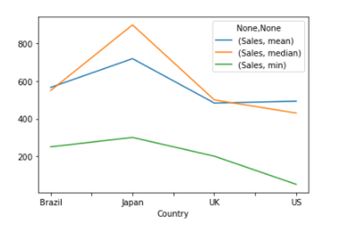
You can also plot the results by using the below code:
Code:
pivot = df.pivot_table(index=['Country'], values=['Sales'], aggfunc={'median','mean','min'}).plot()
plt.show()
Output:
Pivot tables are traditionally associated with MS Excel. Yet, you can simply create a pivot table in Python using pandas.The concepts discussed here can be applied across large number of various scenarios.