Explain different types of Plots that we generally use in Machine Learning?
There are different plots we use in Machine Learning which can be visualized using python. Different plots are listed below.
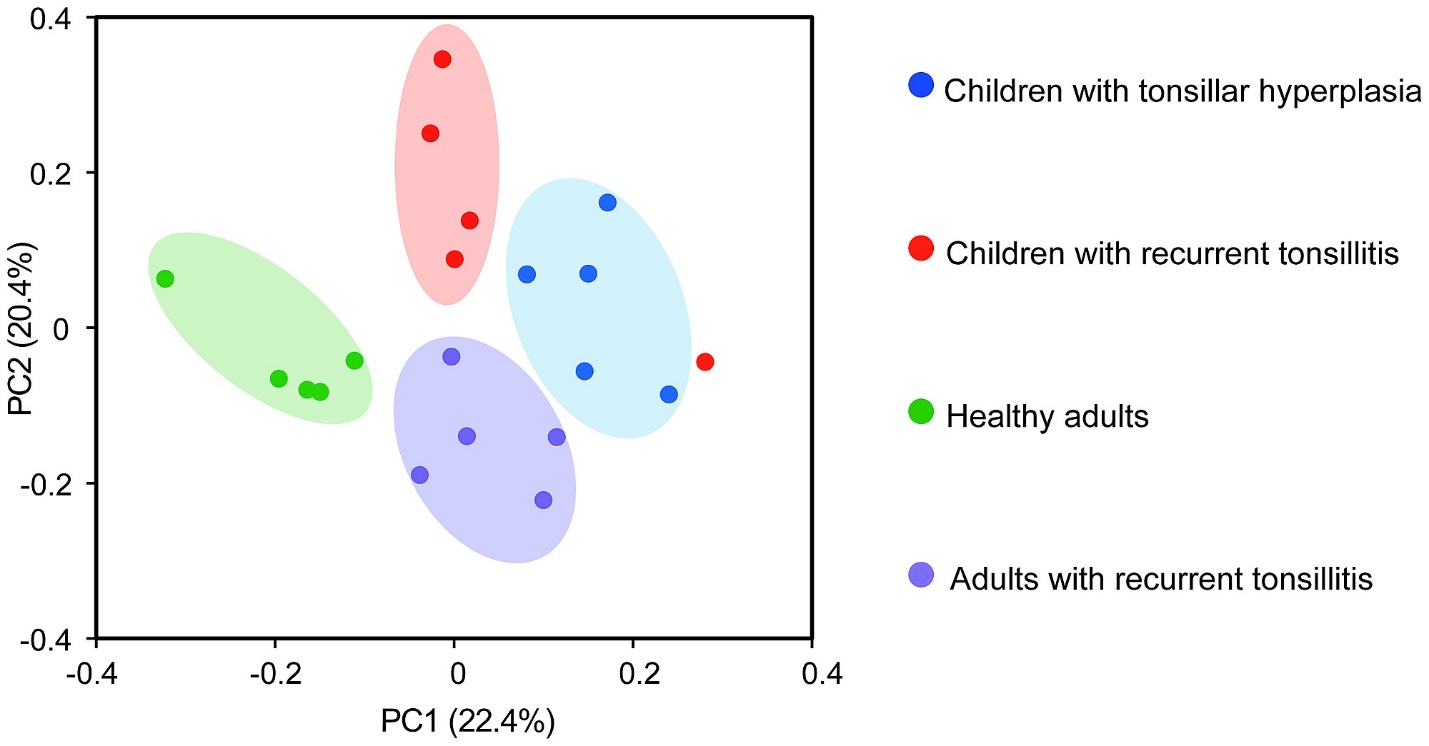
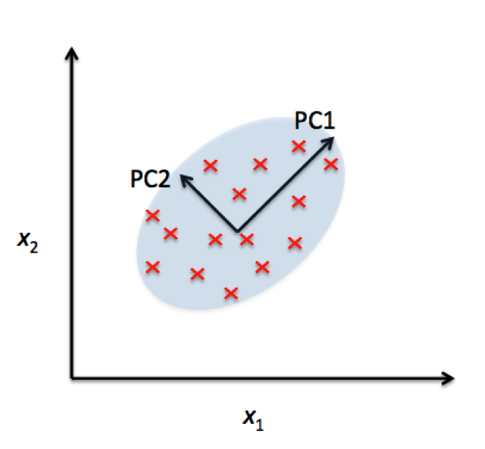
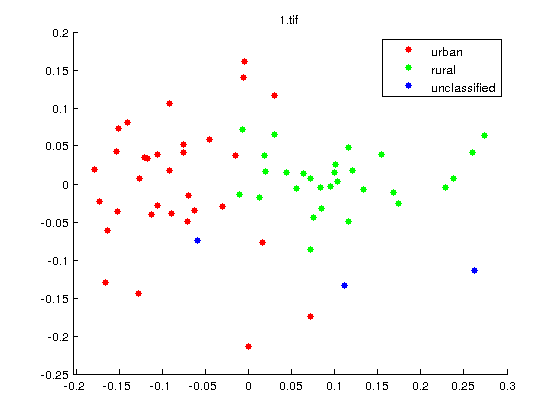
i) Scatter plot
ii) Box plot
iii) Bar chart
iv) Line plot
v) Histogram
Share: