Explain in detail about Data Visualizations?
Data visualization is the graphical representation of information and data. By using visual elements like charts, graphs, and maps, data visualization tools provide an accessible way to see and understand trends, outliers, and patterns in data.
Common general types of data visualization:
- Charts
- Tables
- Graphs
- Maps
- Infographics
- Dashboards
- Line charts
1. Line charts
These are one of the most basic and commonly used visualizations. They show a change in one or more variables over time.

When to use: You need to show how a variable changes over time.
2. Area charts
A variation of line charts, area charts display multiple values in a time series.

When to use: You need to show cumulative changes in multiple variables over time.
3. Ranking
Bar charts
These charts are like line charts, but they use bars to represent each data point.

When to use: Bar charts are best used when you need to compare multiple variables in a single timeframe or a single variable in a time series.
4. Population pyramids
Population pyramids are stacked bar graphs that depict the complex social narrative of a population.

When to use: You need to show the distribution of a population.
5. Part to Whole Pie charts
These show the parts of a whole in the form of a pie.

When to use: You want to see parts of a whole on a percentage basis. However, many experts recommend using other formats instead because it’s more difficult for the human eye to make sense of the data in this format because due to increased processing time. Many argue that a bar chart or line graph make more sense.
6. Tree maps
Tree maps are a way to display hierarchal data in a nested format. The size of the rectangles are proportional to each category’s percentage of the whole.

When to use: These are most useful when you want to compare parts of a whole and have many categories.
7. Deviation
Bar chart (actual vs. expected)
These compare an expected value vs. the actual value for a given variable.

When to use: You need to compare expected and actual values for a single variable. The above example shows the number of items sold per category vs. the expected number. You can easily see sweaters underperformed expectations above all other categories, but dresses and shorts overperformed.
8. Correlation
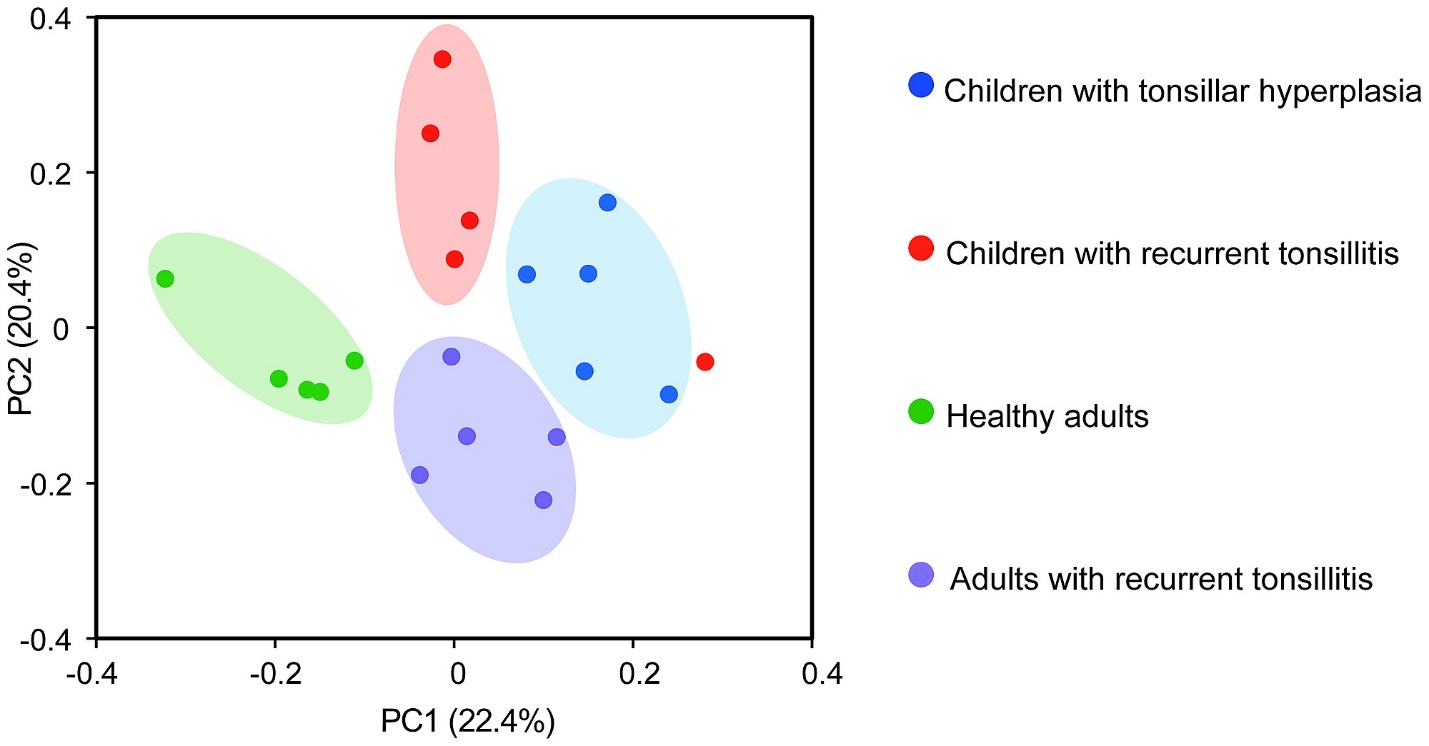
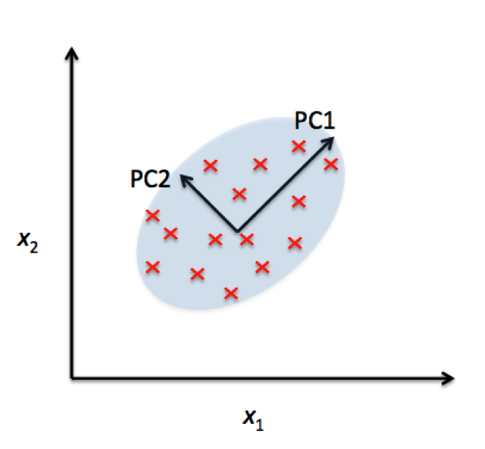
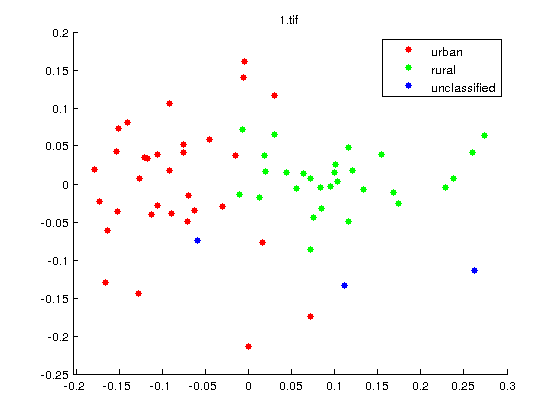
Scatter plots
Scatter plots show the correlation between two variables in the form of an X and Y axis and dots that represent data points.

When to use: You want to see the correlation between two variables.
9. Frequency Distribution
Histograms
Histograms plot the number of times an event occurs within a given data set and presents in a bar graph format.

When to use: You want to find the frequency distribution of a given dataset. For example, you wish to see the relative likelihood of selling 300 items in a day given historical performance.
10. Box plots
These are non-parametric visualizations that display a measure of dispersion. The box represents the second and third quartile (50%) of data points and the line within the box represents the median. The two lines extending outside the box are called whiskers and represent the first and fourth quartile, along with the minimum and maximum value.

When to use: You want to see the distribution of one or more datasets. These are used instead of histograms when space needs to be minimized.
11. Nominal Comparison
Bubble charts
Bubble charts are like scatter plots but add more functionality because the size and/or color of each bubble represents additional data.

When to use: When you have three variables to compare.
12. Heat maps
A heat map is a graphical representation of data in which each individual value is contained within a matrix. The shades represent a quantity as defined by the legend.

When to use: These are useful when you want to analyze a variable across a matrix of data, such as a timeframe of days and hours. The different shades allow you to quickly discern the extremes. The above example shows users of a website by hour and time of day during a week.
13. Geographical Comparison
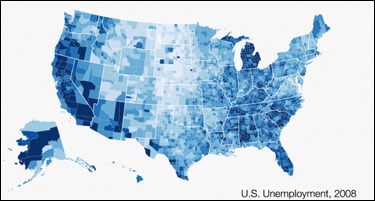
Chloropleth
Choropleth visualizations are a variation of heat maps where the shading is applied to a geographic map.

When to use: You need to compare a dataset by geographic region.
14. Flow
Sankey diagram
The Sankey diagram is a type of flow diagram in which the width of the arrows is displayed proportionally to the quantity of the flow.

When to use: You need to visualize the flow of a quantity. The example above is a famous example of Napoleon’s army as it invaded Russia during a cold winter. The army begins as a large mass but dwindles as it moves towards Moscow and retreats.
15. Relationships
Network diagram
These display complex relationships between entities. It shows how each entity is connected to the others to form a network.

When to use: You need to compare the relationships within a network. These are especially useful for large networks. The above shows the network of flight paths for Southwest airlines.