Explain in detail about Line Chart?
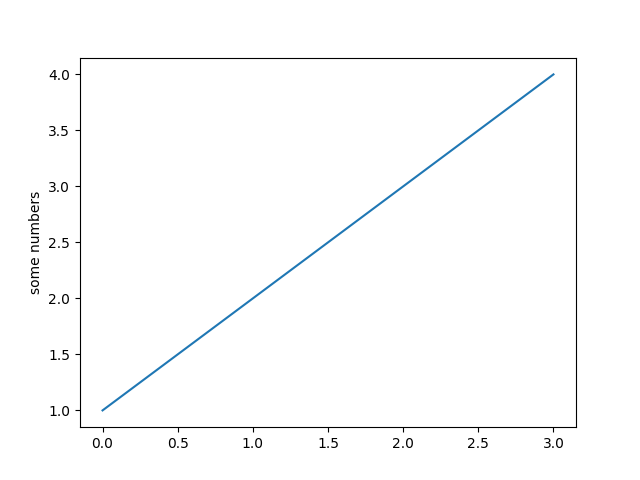
The line chart is represented by a series of datapoints connected with a straight line. Line charts are most often used to visualize data that changes over time.
import matplotlib.pyplot as plt

plt.plot([1, 2, 3, 4])

plt.ylabel('some numbers')

plt.show()
Share: