Explain in detail about Scatter Plot?
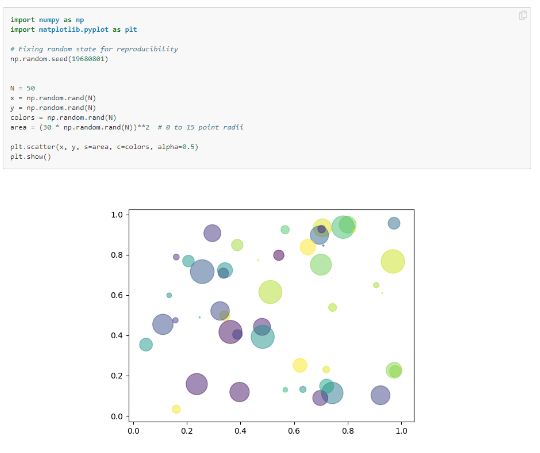
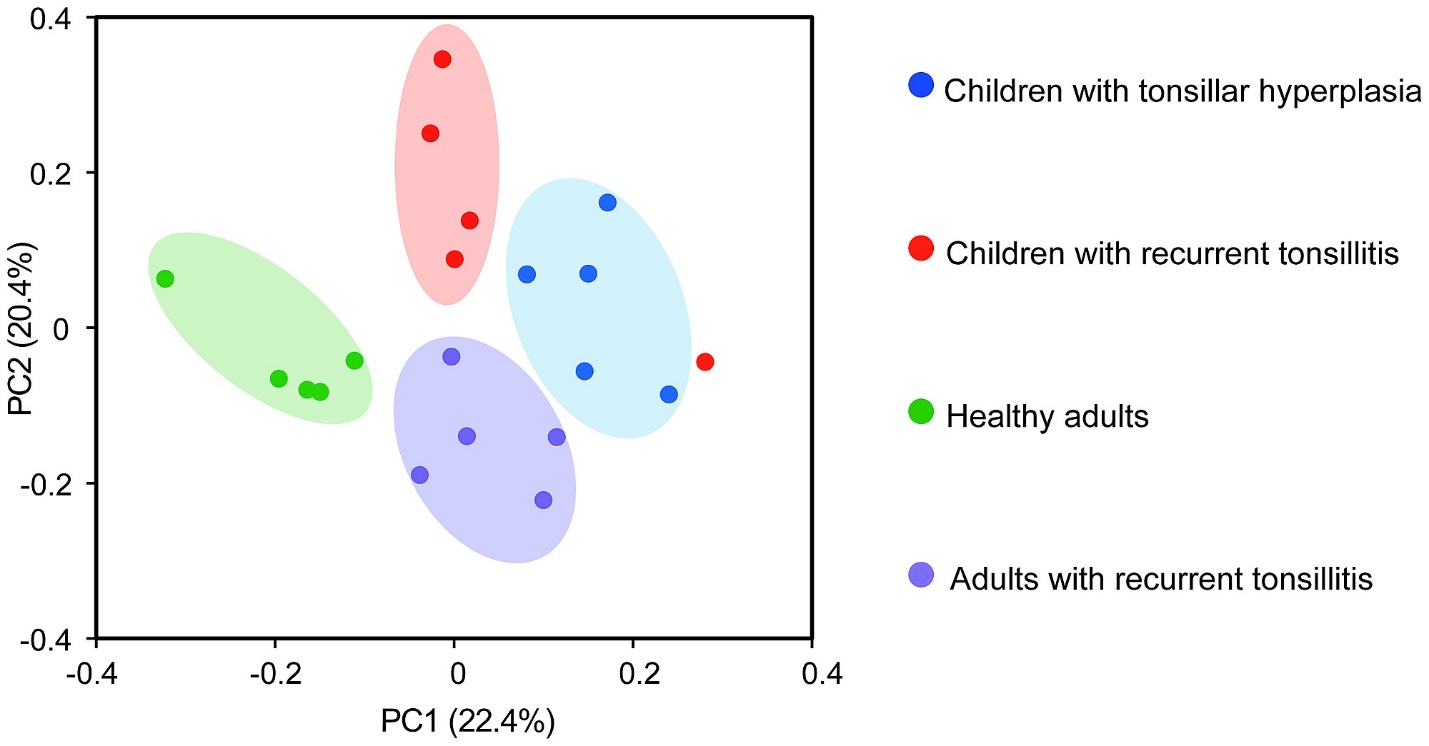
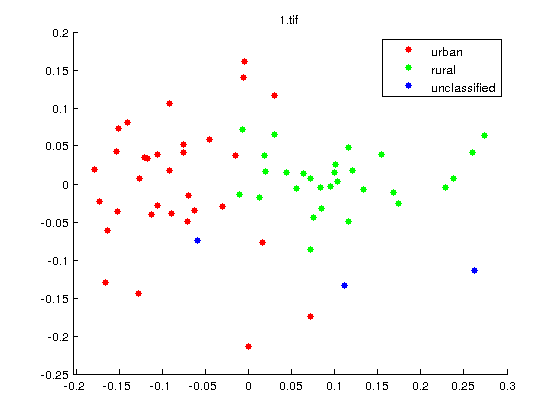
A scatter plot, also known as a scatter graph or a scatter chart, is a two-dimensional data visualization that uses dots to represent the values obtained for two different variables – one plotted along the x-axis and the other plotted along the y-axis.
Share:


