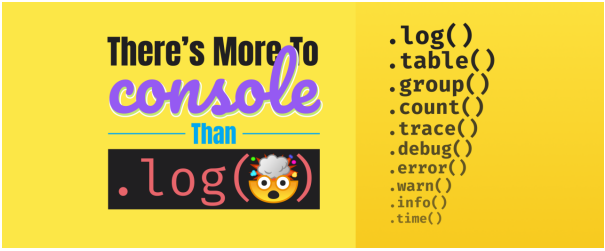
Find out which console.log() prints the log in JavaScript
- There is a logging framework that provides additional information, such as timestamps and logging location. So this is the best solution rather than calling Console.log().
- We can use the command console Log Viewer to display: a single log or trace file. By using this command we will get all log and trace files from a log directory.
- Don’t use log for that purpose, use log breakpoints
- How to set log breakpoints?
To set a breakpoint condition:
Right-click the breakpoint symbol and select Conditions (or press Alt + F9, C). Or hover over the breakpoint symbol, select the Settings icon, and then select Conditions in the Breakpoint Settings window.
How to set a breakpoint in source code?
To set a breakpoint in source code, click in the far left margin next to a line of code. You can also select the line and press F9, select Debug > Toggle Breakpoint, or right-click and select Breakpoint > Insert breakpoint. The breakpoint appears as a red dot in the left margin.
- General instructions for working with breakpoints.
- The breakpoint is a toggle. You can click it, press F9, or use Debug> Toggle Breakpoint to delete or reinsert it.
- To disable a breakpoint without deleting it, hover over or right-click it, and select Disable breakpoint. Disabled breakpoints appear as empty dots in the left margin or the Breakpoints To re-enable a breakpoint, hover over or right-click it, and select Enable breakpoint.
- Set conditions and actions, add and edit labels, or export a breakpoint by right-clicking it and selecting the appropriate command, or hovering over it and selecting the Settings
Share:


