How to debug JavaScript?
In order to understand ‘how to debug JavaScript’, we must first understand the concept of “debugging”.
What is Code Debugging?
It is possible to make many mistakes while coding or writing the program, including logical errors, syntax errors, etc. Debugging allows us to identify the location/point where an error occurred because we can execute our code one line at a time while debugging. We are able to correct our mistakes once we identify the point where we have made a mistake. Using the debug tools, we can also make temporary changes to the program’s code. When an error is discovered in a code, the entire process of correcting the code is referred to as debugging.
Code Debugging can be described as the process of finding and correcting programming errors.
JavaScript Debuggers
It is evident that debugging is not an easy task because it requires a lot of practice and experience, so fortunately, all modern browsers have a built-in debugger. As a result of the web browser, we can turn on or off Debugging whenever we want to use it, as well as set breakpoints (where the program’s code can stop) and examine variables while the program is running.
As a general rule, we can open the JavaScript debugging tool with the F12 key to display the JavaScript values by using the “console”.
The console.log () Method
Only if the browser supports debugging can we use the console.log() method to display JavaScript values.
Syntax of console method
<script>
x = 7;
y = 9;
z = x + y;
console.log(c);
</script>
An example will help us understand it better:
<!DOCTYPE html>
<html>
<body>
<h1>This is my first Javascript page</h1>
<script>
x = 7;
y = 9;
z = x + y;
console.log(c);
</script>
</body>
</html>
How to set breakpoints?
Using a debugging tool, we can set breaking points in the JavaScript code of the program. The execution of the program is stopped when the control reaches a breaking point, allowing us to examine the JavaScript values. By pressing the play button, we can resume the execution of the program after examining the JavaScript values.
The debugger Keyword
With the “debugger;” keyword, we can stop the execution of the program at any point in the program. In any case, this keyword will only function if the debugger function is available. If the debugger function is available, we can also check the JavaScript values. After examining the JavaScript values, we can resume the execution and look for additional errors to be corrected.
Syntax
<script>
var x = 16 * 5;
debugger;
document.getElementById("demo").innerHTML = x;
</script>
Program
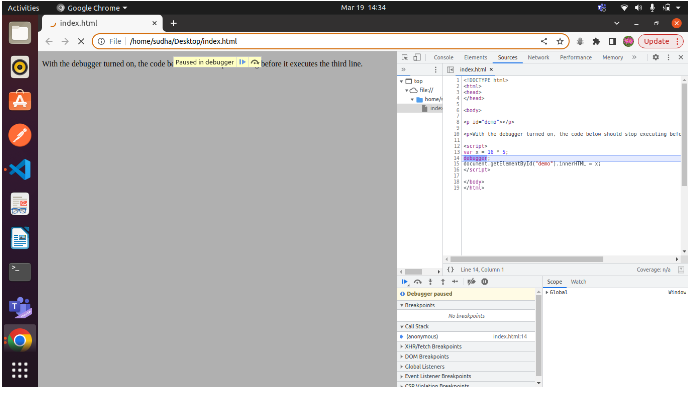
<!DOCTYPE html>
<html>
<head>
</head>
<body>
<p id="demo"></p>
<p>With the debugger turned on, the code below should stop executing before it executes the third line.</p>
<script>
var x = 16 * 5;
debugger;
document.getElementById("demo").innerHTML = x;
</script>
</body>
</html>
Explanation of program
We have created a variable x in which we have multiplied 15 by 5 and used the debugger keyword to set a breaking point. During the debugging process, the execution of the program will be stopped at this line, allowing us to examine the value. We may resume the execution if no changes are required.
Let’s see an example with practical
- The first step is to open the console in the Chrome browser by following the steps provided.
- The debugging process can be initiated once the console has been opened.
- During the debugging process, the execution of the programs will stop at the line where we have created a breaking point by using the “debugger” keyword. This keyword also provides essential information regarding JavaScript values. The following image illustrates how the console and debugging process look.