
Integrating Python in Power BI
Power BI is a proprietary productservice by Microsoft. It offers interactive visualizations and business intelligence capabilities with a simple interface enough for end users to create their own reports and dashboards. Since 2018, Power BI was designed to integrate statistical and general-purpose software like R and Python.
A pipeline of any business problem includes gathering, cleaning, exploring, transforming data to come up with predictions for future events. The result is presented in a dashboard. Power bi integrated with python helps a data scientist to understand the complete pipeline of solving complex business problems. Thus, Power BI is the new talk of the town for execution of embedded analytics.
This article will help you understand the integrating capabilities of Power BI and Python and go hands-on to perform certain tasks that a standalone system would not achieve easily.
Setup the integrated environment
The initial step is to get an integrated environment. For this you need to have a distribution of Python installed on your machine where you can have it from python.org
After installation the integrated environment requires you to install four python packages such as Pandas (for data manipulation and analysis), Matplotlib and Seaborn (for plotting), and Numpy (for scientific calculations).
To install these packages, you can use PIP command in your command-line.
pip install pandas
pip install matplotlib
pip install numpy
pip install seaborn
Next you have to enable Python Scripting in Power BI. For this open Power BI to check whether it automatically detects the Python distribution installed on your machine. Go to Files -> Options and Settings -> Options. Go to Python Scripting where you should see the Home Directory for Python installed on your machine.
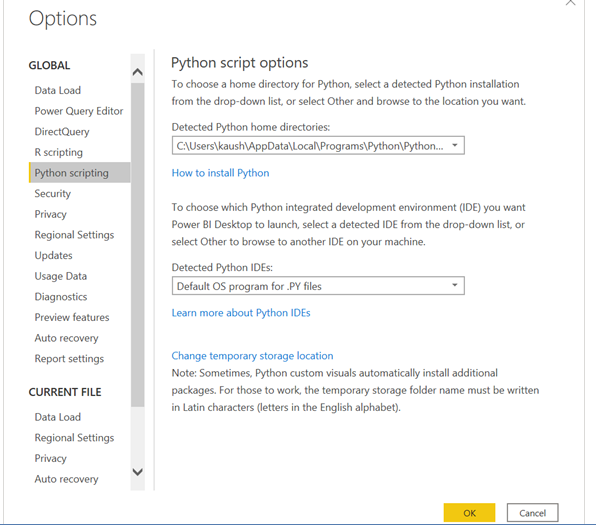
Import Data using Python script
Test whether Python works within the Power BI stack. To start with import a small dataset in Power BI using Python script.
To do this go to the Home ribbon, click on Get Data and select Other. Here you can import data from a wide-ranging list of sources, especially, Web, Hadoop Distributed File System (HDFS), Spark, etc. instead of using scripts like R or Python.
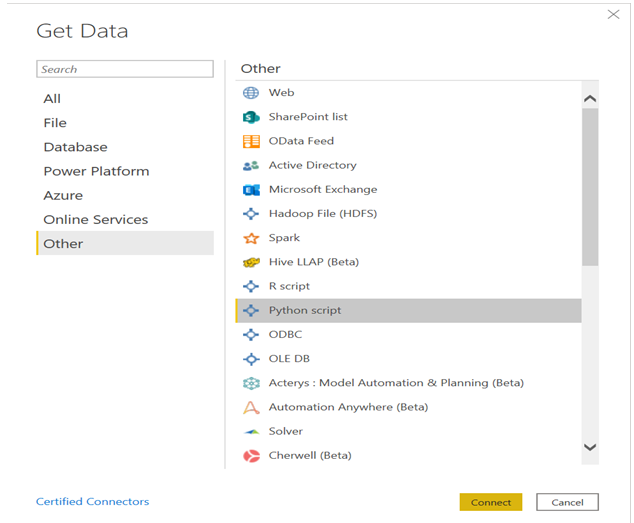
Click on Connect which opens up a section to write python script. Example shown below.
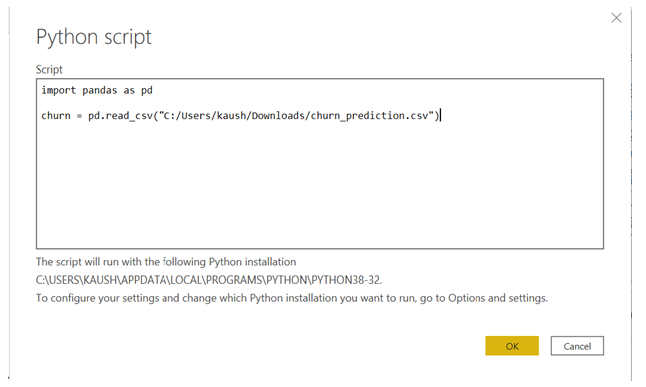
Click on OK to load the navigator and it will ask you to select the dataset, then click Load.
You can also view the data to check whether the data has been loaded. Now, Power Query is ready to use for performing one-click data transformations.
Using Power Query to transform data
Power Query Editor makes easy to shape and transform the data with a single click. In addition to this Power BI also keeps a record of all the operations that go into the pipeline of data transformation before any analysis.
After loading the data in Power BI, click on Transform Data below the Home tab to open Query Editor.

This will open the Query Editor which gives a lot of options to perform cleaning, reshaping, and transformation of data.
You can convert categorical variables into text field. It is good practice to rename every step you perform to recall easily. After performing the transformation step, click on Close & Apply (on the top left corner) to apply these transformations to the data.
Using Python’s statistical within Power BI
This section demonstrates how to create a correlation matrix heatmap using Python’s correlation function. This heatmap can be displayed on the Report section in Power BI.
Go to the Report section in Power BI and click on Py symbol below the Visualizations section. At the left, you can find an empty Python visual appearing and a Python script Editor popping up at the bottom. Simply, Power BI gives you the option of creating visualizations with scripts.
Present the Values field is empty.
To demonstrate the correlation heatmap, you will get all the continuous variables into the Values field. This is an important step else Power BI wouldn’t recognize these variables to be part of the visualization.
The Python script is automatically populated with the following codes, as we get the variables into the Values field.
#The following code to create a dataframe and remove duplicated rows is always executed and acts as a preamble for your script:
# dataset = pandas.DataFrame(age, average_monthly_balance_prevQ, average_monthly_balance_prevQ2, current_balance, current_month_balance, current_month_credit, current_month_debit, dependents, previous_month_balance, previous_month_credit, previous_month_end_balance, previous_month_debit, vintage)
# dataset = dataset.drop_duplicates()
# Paste or type your script code here:
Here write a few lines of Python code to create a correlation matrix heatmap using the seaborn package. Example shown below.
# import the charting libraries matplotlib and seaborn
import matplotlib.pyplot as plt
import seaborn as sns

# create the correlation matrix on the dataset
corr = dataset.corr()
# create a heatmap of the correlation matrix
sns.heatmap(corr, cmap="YlGnBu")
# show plot
plt.show()
Finally use Run Script button, which produces a correlation matrix heatmap.
Example shown below.
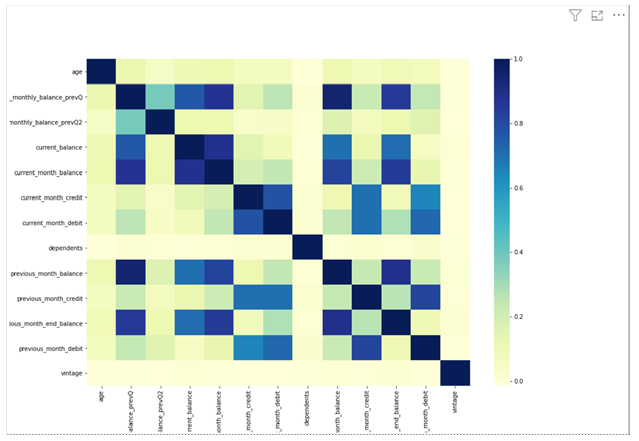
Therefore, we can draw some useful insights from analyzing the data.
To conclude, this integrated environment makes it easy for data scientists and business intelligence professionals to create interactive visualizations. They can easily make the most of on the beneficial aspects of both of these tools.


