Power BI – Introduction
Power BI
Microsoft Power BI is a user-friendly business intelligence (BI) platform that empowers non-technical business professionals to aggregate, analyze, visualize, and share data. With Power BI, experts can easily process, analyze, and present massive amounts of data to extract insights, draw conclusions, and share results in the form of reports and dashboards across departments.
This BI platform offers a combination of software services, apps, and connectors that work together to convert unrelated data sources into coherent, visually immersive, and interactive insights. It supports a variety of data sources, including Excel spreadsheets and cloud-based and on-premises hybrid data warehouses. Power BI allows you to connect with your data sources effortlessly, visualize and uncover important data, and share it with anyone, whether it be a specific individual or a wider audience.
Elements Of Power BI
Power BI comprises three core components:
- Firstly, there is a Windows desktop application, named Power BI Desktop.
- Secondly, there is an online Software as a Service (SaaS) called the Power BI service.
- Finally, there are Power BI mobile applications available for Windows, iOS, and Android devices.
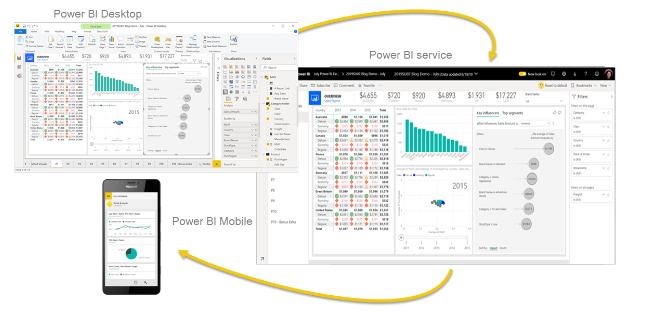
The trio of Power BI Desktop, the Power BI service, and Power BI mobile apps are designed to enable you to generate, disseminate, and consume business insights in the manner that best suits your needs and responsibilities.
Additionally, Power BI incorporates two other components:
- Power BI Report Builder allows for the development of paginated reports that can be shared via the Power BI service.
- Power BI Report Server is an on-premises report server that allows you to publish your Power BI reports created within Power BI Desktop.
Power BI for Diverse Roles
Power BI is utilized differently based on the user’s role. For instance, one may utilize the Power BI service primarily to view dashboards and reports, while a colleague who creates business reports and performs data analysis may frequently use Power BI Desktop or Power BI Report Builder to design reports, subsequently publishing them to the Power BI service for others to access. A salesperson might primarily use the Power BI mobile app to track progress on sales targets and examine information on new sales leads.
Developers, on the other hand, can leverage Power BI APIs to integrate data into datasets or embed dashboards and reports within their custom applications. Meanwhile, an individual with a new idea for a visual can construct it independently and distribute it to others.
The approach you adopt to use Power BI depends on which feature or service is best suited for your particular circumstances. For example, you can utilize Power BI Desktop to produce reports for your team regarding customer engagement metrics, while also monitoring inventory and production progress via a real-time dashboard in the Power BI service. It’s feasible to develop a paginated report of invoice mailings based on a Power BI dataset. With each aspect of Power BI at your disposal, it’s an incredibly flexible and compelling tool.
Power BI Workflow
The typical workflow for Power BI commences with connecting to source data in Power BI Desktop and developing a report based on that data. The report is subsequently published from Power BI Desktop to the Power BI service and shared, enabling business users on both the Power BI service and mobile devices to view and interact with the report.
Organizations can use the data models created in Power BI in a variety of ways, including the following:
- Conveying insights through charts and data visualizations.
- Exploring hypothetical scenarios within the data.
- Creating real-time reports that can respond to questions and aid with forecasting to guarantee that departments meet business metrics.
Features of Power BI
- Power BI offers faster and more efficient performance with smaller data volumes.
- Power BI provides a user-friendly interface based on Microsoft Office 365 that is easy to comprehend.
- Power BI enables working with multiple data sources, including Excel, Text/CSV, JSON, SQL Server databases, IBM DB2, MySQL, and more.
- Power BI can integrate with the R programming language and supports various Data Analysis Expression (DAX) functions and measures.
- Power BI is functionally integrated with the Microsoft Azure cloud platform.
- Power BI facilitates the analysis of insights and patterns in datasets.
Power BI components & Pricing
Power BI is a collection of apps that can be accessed through desktop, SaaS, or mobile devices. It provides users with the flexibility to create and share business insights that align with their roles. The components of Power BI are designed to facilitate the creation and sharing of data reports.
These components include:
- Power Query: A tool for mashing up and transforming data.
- Power Pivot: A tool for tabular data modeling in memory.
- Power View: A tool for data visualization.
- Power Map: A tool for 3D geospatial data visualization.
- Power Q&A: A natural language question and answer engine.
Power BI also supports dozens of data sources, including files, databases, other Power BI data sets, Azure data connections, and many online services.
The three levels of Power BI based on pricing are Power BI Desktop, Power BI Pro, and Power BI Premium.
There is no charge for the desktop version, but $9.99 per user per month for the Pro version. Pricing for Power BI Premium varies based on the size of deployment and the number of users. There are two tiers: per user and per capacity. Premium per user starts at $20 per month, and Premium per capacity starts at $4,995 per capacity per month.