Power BI – Desktop
Microsoft Power BI Desktop is a no-cost software tool that you can install on your computer to access, transform, and visualize your organization’s data. Its strength lies in its ability to connect to multiple data sources and merge them into a single data model. With this capability, you can create impactful reports and visuals that can be shared within or outside your organization.
Business intelligence professionals often use Power BI Desktop to generate reports that they share with interested parties and stakeholders. However, even if you’re not a business analyst, you can use this tool to retrieve data from different sources and produce engaging reports that you can share with others.
Features of Power BI Desktop
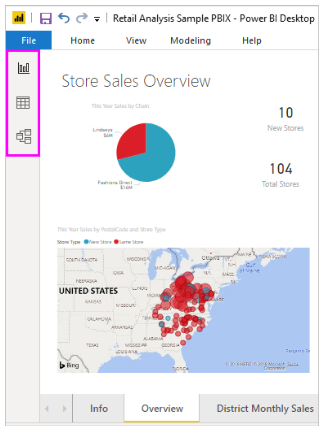
There are three types of views, namely Report, Data, and Model. Reports and various visuals can be created in the Report view. The Data view displays the tables, measures, and other data in the data model associated with your report. Your data model is modeled in the Model view, where you understand and manage the relationships among tables.
This image shows the three views on the left side of the canvas:
The free version of Power BI enables users to analyze data, generate real-time reports, and share them online. Upgrading to the Pro version allows users to share those reports and dashboards with others and offer more sophisticated analytics quickly. Furthermore, it incorporates Power Query and Power Editor, giving it an advantage over other Business Intelligence Tools.
Microsoft Power BI Desktop is an analysis and reporting tool that can be installed on a computer to create live reports and dashboards. The tool can be linked to Power BI Service to distribute these reports to decision-makers and stakeholders, providing them with insight into the current state of the business.
Power BI combines all of its components and analytical capabilities onto a single platform. Its user-friendly interface makes it possible for even non-technical users to develop compelling reports, data models, and custom dashboards.

Power BI Desktop’s common uses
- Data connection.
- Create a data model by transforming and cleaning data.
- Provide visual representations of the data, such as charts or graphs.
- Reports are collections of visuals on one or more pages.
- Power BI allows you to share reports with others.
Data analysts (sometimes referred to as analysts) and business intelligence professionals (often referred to as report creators) are responsible for all the tasks listed above. In addition to analysts and report creators, other types of users use Power BI Desktop to create compelling reports, pull data from multiple sources, and build data models for their colleagues.
Connect to data
The first step in getting started with Power BI Desktop is to connect to data. From Power BI Desktop, you can connect to a variety of data sources.
To connect to data
1.Select Get Data > More from the Home ribbon.
You can connect Power BI Desktop to many categories via the Get Data window.
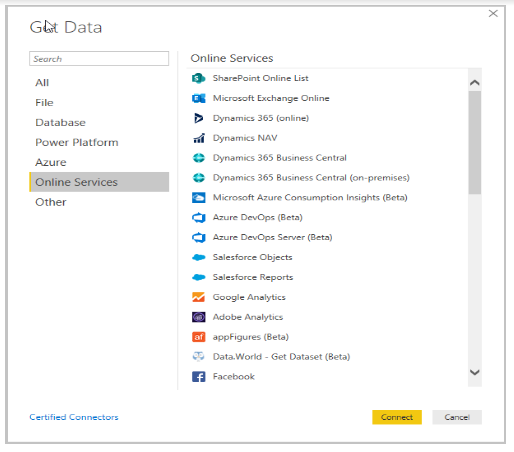
2. Selecting a data type prompts you for information such as the URL and credentials Power BI Desktop needs to connect to the data source.
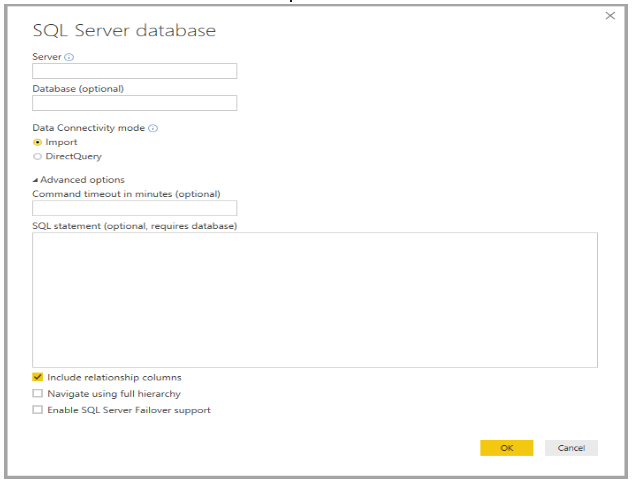
3. You may want to transform the data after connecting to one or more data sources.
Create a model by transforming and cleaning data
Power BI Desktop has a built-in Power Query Editor that enables you to refine and restructure data. With this editor, you can alter your data by changing its type, discarding columns, or integrating data from various sources. The process is akin to sculpting: you start with a large block of clay (or data), then shape it by removing or adding pieces until the data takes the desired form.
To start Power Query Editor:
- Select Transform data from the Queries section on the Home ribbon.
Power Query Editor appears.
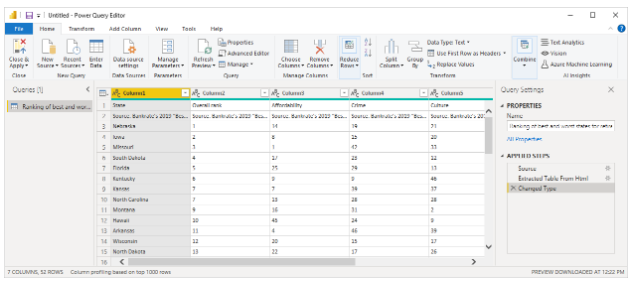
Power Query Editor tracks each modification you make to the data, whether it’s renaming a table, transforming a data type, or removing a column. When the query reconnects to the data source, it executes these steps to ensure the data is consistently transformed to your specifications.
The Power Query Editor window pictured below demonstrates a shaped query that has been transformed into a model.

Once your data is how you want it, you can create visuals.
Create visuals
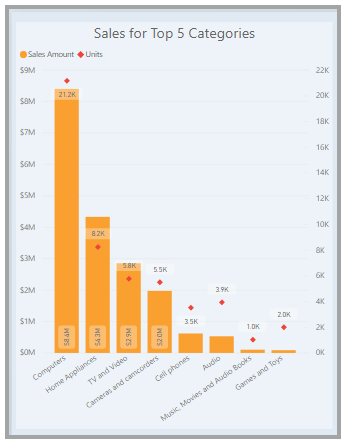
Once you have a data model, you can add fields to the report canvas to build visuals. A visual is a graphical representation of the data contained in your model. Power BI Desktop provides a wide variety of visual types to choose from. The sample visual below displays a basic column chart.
To create or change a visual:
- From the Visualizations pane, select the Build visual icon.
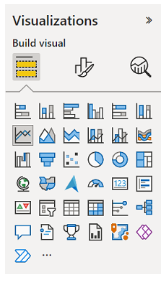
If you currently have a visual chosen on the report canvas, it will change to the type you selected. If no visual is currently selected on the canvas, a new visual will be generated based on your selection.
Create reports
Frequently, you’ll need to build a set of visuals that demonstrate different aspects of the data used in creating your Power BI Desktop model. A compilation of visuals within a single Power BI Desktop file is known as a report. A report can have multiple pages, much like an Excel file can have multiple worksheets.
With Power BI Desktop, you can construct sophisticated and visually compelling reports using data from various sources, all within a single report that can be shared with colleagues in your organization.
The image below displays the initial page of a Power BI Desktop report, labeled “Overview,” as seen on the tab at the bottom of the image.

Share reports
You can publish a report to the Power BI service once it is ready for sharing, and anyone in your organization with a Power BI license can view it.
To publish a Power BI Desktop report:
- From the Home ribbon, select Publish.
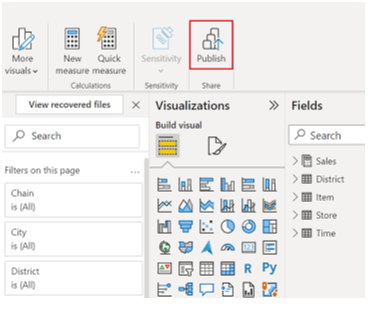
Your Power BI account is used to connect Power BI Desktop to the Power BI service.
2. Power BI prompts you to select where in the Power BI service you want to share the report, such as your workspace, your team workspace, or another location.
To share reports with Power BI, you must have a license.