Power BI – Desktop working
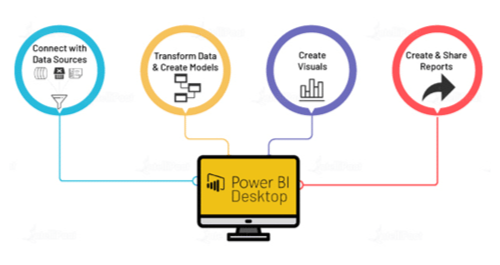
Power BI Desktop simplifies and streamlines the process of creating business intelligence repositories and reports, which can otherwise be scattered, disconnected, and arduous. This process has four main steps when using Power BI Desktop:
- Connect to multiple data sources and extract data.
- Shape the data using queries that build insightful and compelling data models.
- Use the data models to create various visualizations and reports.
- Share your report files with others who can leverage, build upon, and share them. You can share Power BI Desktop .pbix files just like any other files.
Connect with Data Sources
Data sources for Power BI Desktop include Excel spreadsheets, CSV files, Q-data feeds, online services, and cloud-based data. Depending on the type of business, this data could be structured, semi-structured, or unstructured.
Connecting with the above data sources is the first step. The data can then be transformed and filtered based on various constraints after being imported from different sources. However, you cannot import more than 10 GB of data into the software. If your data is bigger than 10 GB, you either have to go for the Power BI Pro version or run direct queries on different data sources.
Transform Data & Create Models
Power Query Editor in Power BI Desktop enables you to extract meaningful insights, eliminate anomalies, and apply conditions to enhance the data’s understanding. It’s akin to sculpting a piece of wood by cutting the edges, removing excess wood, smoothing out rough spots, and adding elements to achieve the desired result.
You can modify columns and data types, as well as assign default values to null columns. In comparison to Tableau’s business analytics, data transformation can be arduous, but Power BI’s features make it effortless and intuitive with drag-and-drop functionality for data modeling.
Create Visuals
Data visualizations are graphical representations of the data you store in a model. Charts, graphs, maps, and KPIs can be created using drag-and-drop features in Microsoft Power BI Desktop.
Visuals can be attached to dashboards or live reports as tiles after they are created. A custom visual also helps you identify problems in various departments and market behavior and make better decisions.
Create & Share Reports
A report is a group of visuals formed from various data models. It may include multiple dashboards with personalized visualizations. In contrast, live reports present real-time analysis of data, streaming from various sources.
With the assistance of Power BI Desktop online, these reports that analyze intricate data with visually appealing displays can be shared with others in your organization.