Power BI – Shape Data
Raw data contains valuable insights, but it needs to be shaped and presented in order to effectively communicate those insights. That’s where Power BI comes in. Power BI is a tool developed by Microsoft for shaping and presenting data in a meaningful way.
To shape your data in Power BI, you can use the Power Query Editor window to provide step-by-step instructions for adjusting and presenting the data. The Transform ribbon and right-clicking on specific data presentations are two of the most common ways to shape your data in Power Query Editor. As you make changes, they are recorded sequentially in the Applied Steps section of the Query Settings pane.
Every time the query connects to the data source, these steps are carried out, ensuring that the data is always shaped the way you specify. This is true whether you’re using the query in Power BI Desktop or sharing it with others through the Power BI service.
Data Shaping
The term “data shaping” refers to the process of transforming data into queries that can be used effectively. By renaming columns and rows, converting text to numbers, and other methods, you can shape your data to suit your needs. Essentially, data shaping is a way to modify the presentation of your data, giving you greater control over the message it conveys to your audience. It’s important to note that the data shaping process does not affect the original data source; it only affects how the data is presented.
The Most Common Data Shaping Techniques
Power BI offers a range of data shaping options that enable you to transform your data into usable queries. These options include removing columns and rows, adding an index column, implementing a sort order, grouping rows, pivoting columns, and creating custom columns. Although there are many techniques available, the most frequently used data shaping methods in Power BI are removing columns and rows, adding an index column, and implementing a sort order.
Removing Columns and Rows
If you have combined multiple data sources, you may find that some columns or rows contain redundant or irrelevant information. In such cases, you can remove them to streamline your data. Follow these steps to remove a column or row in Power BI:
- Select the column or row that you want to delete.
- Click on the “Home” tab located in the top menu bar.
- Click on “Remove Columns” or “Remove Rows” depending on what you want to delete.
Adding Index Columns
To arrange your data in numerical order, you can add an index column in Power BI. Similar to the index of a book, an index column makes it easier to locate and navigate the data. Here are the steps to add an index column to a table:
- Go to the “Home” tab.
- Click “Edit Queries,” which will open the Queries panel.
- Select the table that you want to index.
- Click “Add Column.”
- Click “Index Column.”
- Click “File.”
- Click “Close and Apply.”
Implementing a Sort Order
To highlight the most relevant data, you can customize the sort order of a table. The steps to implement a particular sort order are as follows:
- Open the visual that you want to sort.
- Click on the “More Options” (ellipsis) button.
- Select “Sort By.”
- Choose your preferred sorting order.
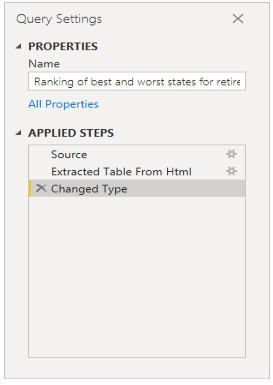
You may notice that the Applied Steps in Query Settings already contain a few steps. You can select each step to see its effect in the Power Query Editor. The first step involves specifying a web source, followed by previewing the table in the Navigator window. In the third step, Power BI recognized whole number data and automatically changed the original data type from Text to Whole numbers when importing it.

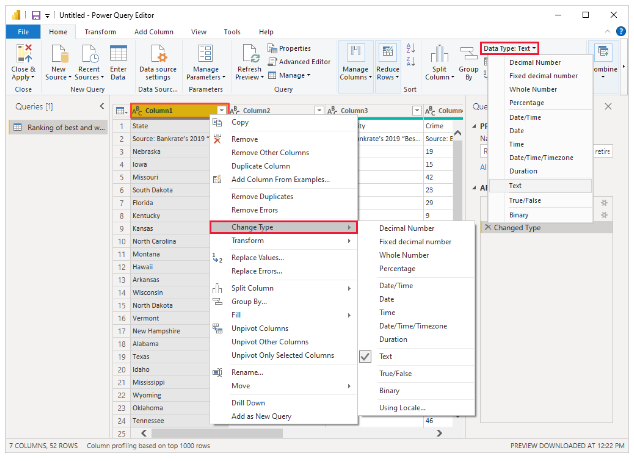
To change the data type of one or more columns, first select the column(s) you want to modify. You can select adjacent columns by holding down the Shift key, or non-adjacent columns by holding down the Ctrl key. Next, you can right-click on a column header, choose “Change Type” from the menu, and select a new data type from the list. Alternatively, you can click the drop-down arrow next to “Data Type” in the Transform group of the Home tab, and select a new data type from the list.

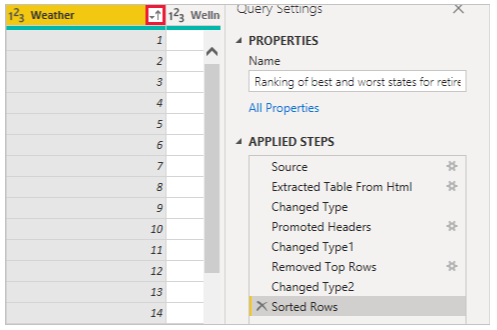
Suppose you’re analyzing sunglasses sales data, and the weather ranking is more important to you than the overall ranking. In that case, you can sort the table by the Weather column. To do this, follow these steps:
- Click the arrow next to the Weather header.
- Select “Sort Ascending” to sort the data by weather ranking.
- The data will now be sorted by weather ranking, and the step “Sorted Rows” will appear in the Applied Steps section.

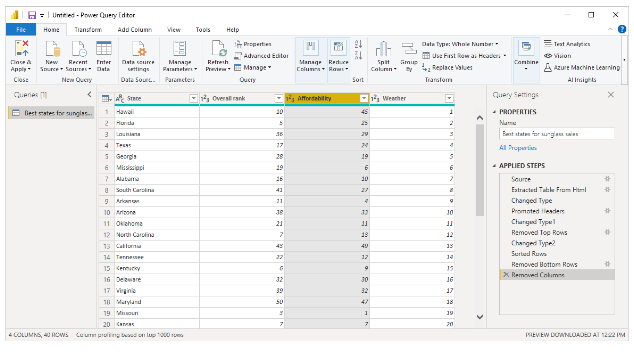
Since you don’t want to sell sunglasses to the worst weather states, you take them off the table. Select Reduce Rows > Remove Rows > Remove Bottom Rows from the Home tab. Select OK after entering 10 in the Remove Bottom Rows dialog box.
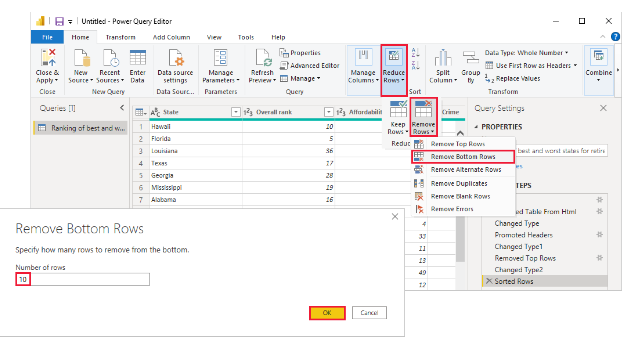

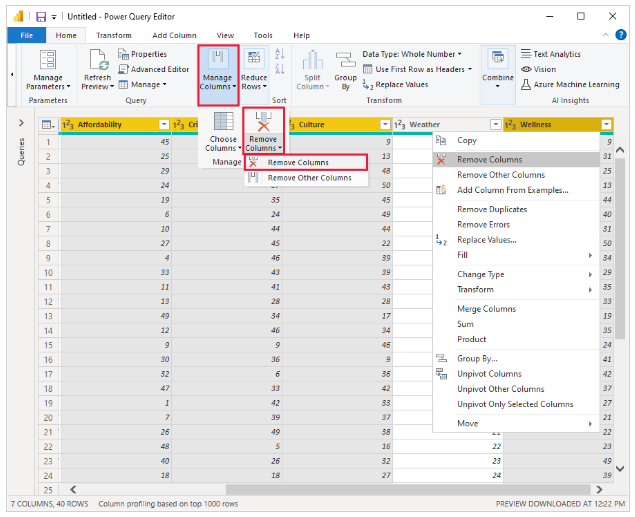
The table is trimmed by removing the bottom 10 rows with the worst weather rankings, and the step “Removed Bottom Rows” is added to the Applied Steps. Next, you decide that the table contains too much information and want to remove some columns such as Affordability, Crime, Culture, and Wellness. To do this, select the header of each column you want to remove, either by holding down the Shift key to select adjacent columns or Ctrl to select non-adjacent columns. Then, in the Manage Columns group of the Home tab, select “Remove Columns,” or right-click one of the selected column headers and choose “Remove Columns” from the menu. The selected columns are removed, and the step “Removed Columns” appears in Applied Steps.

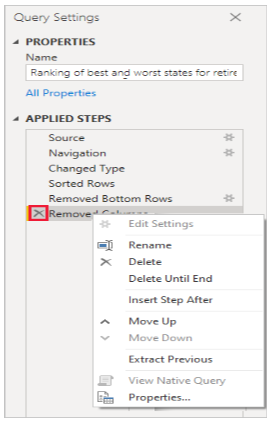
If you change your mind and decide that the Affordability column is important for your sunglasses sales analysis, you can easily undo the previous step by selecting the X delete icon next to the “Removed Columns” step in the Applied Steps pane. Then, you can redo the step but only select the columns you want to delete. Alternatively, you can delete each column as a separate step for more flexibility.
To modify the Applied Steps further, you can right-click on any step and choose to delete it, rename it, move it up or down in the sequence, or add or delete steps after it. However, note that for intermediate steps, Power BI Desktop will warn you if the change could impact later steps and potentially break your query.

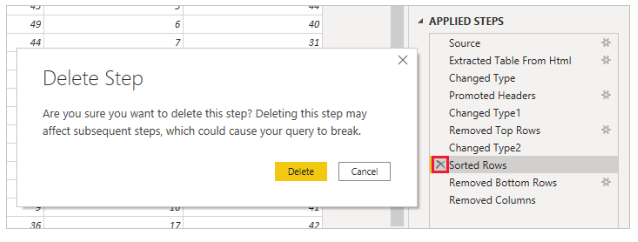
Suppose you want to stop sorting the table by Weather. If you attempt to delete the Sorted Rows step in Power BI Desktop, a warning message appears indicating that doing so may result in a broken query. This is because removing the sort step will cause different rows to be removed, as you had previously removed the bottom 10 rows after sorting by weather. Additionally, if you try to insert a new intermediate step at the Sorted Rows step, you will receive a warning message.

Lastly, you change the table title to sunglass sales instead of retirement. Replace the old title with Best states for sunglass sales under Properties in the Query Settings pane.
The finished query for your shaped data looks like this: