Power BI – The Center (Data) Pane
- The center pane in Power Query Editor is the Data pane, which displays the data of the currently selected query. This pane allows you to perform data transformations on your data and apply any necessary clean-up operations.
- The Data pane provides a preview of your data, showing the dataset’s first few rows and columns. You can use the scrollbar at the bottom of the pane to navigate through the data and explore the data in greater detail.
- In the Data pane, you can also perform various data transformation operations, such as filtering, sorting, and grouping your data. Additionally, you can create new columns, merge tables, and perform calculations using the formula bar.
- As you perform transformations on your data, the changes will be reflected in real-time in the preview window. This allows you to quickly see the effects of any transformations you apply and make any necessary adjustments.
- Overall, the Data pane in Power Query Editor provides powerful tools for transforming and cleaning your data, making it easier to prepare your data for analysis in Power BI or other data visualization tools.
- The following image shows the Web data connection that was established earlier. Selecting the Overall score column and right-clicking its header reveals the menu options available. Many of the items in the right-click menu are also buttons on the ribbon tabs.
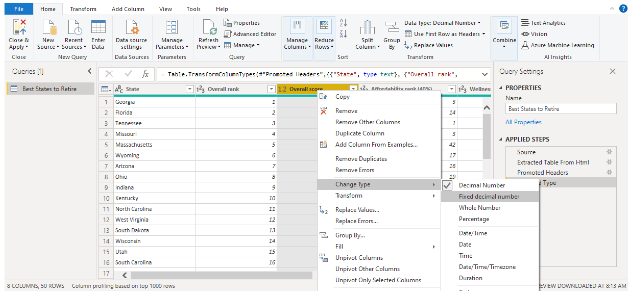
- Right-clicking a menu item (or a ribbon button) applies the step to the data. Query steps are also saved as part of the query. The steps are recorded in sequential order in the Query Settings pane.