What do you mean by Box Plot?
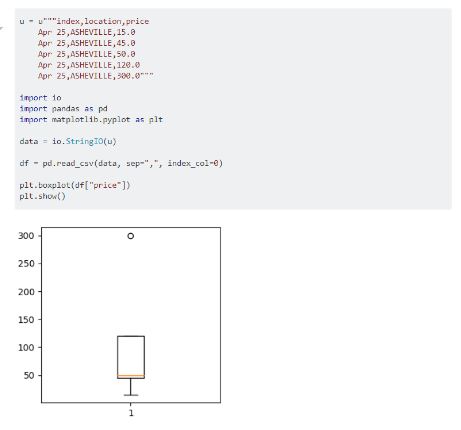
A boxplot is a standardized way of displaying the distribution of data based on a five numbered summary (“minimum”, first
Share:
A boxplot is a standardized way of displaying the distribution of data based on a five numbered summary (“minimum”, first