Top 100+ Machine learning interview questions and answers
1. What do you mean by Machine Learning and various applications?
Machine Learning is the series of the Algorithms through which Machine can learn without being programmed explicitly. It is a simple concept that machine takes data and learn from the data. It also allows machine to learn new things from the given data. Learn more>>>
2. What are the differences between Supervised Machine Learning and Unsupervised Machine Learning?
In Supervised learning, we train the machine using data which is well labeled which means some data is already tagged with the correct answer. A supervised learning algorithm learns from labeled training data which helps to predict outcomes for unforeseen data. Learn more>>>
3. What is the difference between Data Analyst and Data Scientist?
A Data Scientist is a professional who understands data from a business point of view. He will make predictions to help businesses take accurate decisions. Data scientists come with skills of computer applications, modeling, statistics and math. They are efficient in picking the right problems, which will add value to the organization after resolving it. Learn more>>>
4. What is the difference between Artificial Intelligence, Machine Learning and Deep Learning?
Machine Learning is a technique of analyzing data, learn from that data and then apply what they have learned to a model to make a knowledgeable decision. Now a days many of big companies use machine learning to give their users a better experience. Learn more>>>
5. What is the difference between Data Mining and Machine Learning?
Data Mining is extracting knowledge from huge amount of data. It is used to get rules from the existing the data. The origin of Data mining is the traditional Databases with unstructured Data. It involves more human interference. It is used in Clustering Analysis. Data mining tools search for meaning in all this information. Learn more>>>
6. What are the differences between Inductive Reasoning and Deductive Reasoning in Machine Learning?
Inductive reasoning includes making a simplification from specific facts, and observations. It uses a bottom-up method. It moves from precise observation to a generalization or simplification. In Inductive reasoning, the conclusions are probabilistic. Learn more>>>
7. What do you mean by Univariate, Bivariate and Multivariate?
Univariate data consists of only one variable. The analysis of univariate data is the simplest form of analysis since the information deals with only one quantity that varies. It does not deal with causes or relationships. The main purpose of this analysis is to describe the data and find patterns that exist within it. Learn more>>>
8. What do you mean by the terms Skewed Data, Outliers, Missing Values and Null Values?
The distribution of the data which is not symmetric is called Skewed data. Skewed Data has one of its tails is longer than the other. The distribution which has its right side has long tail is called positively skewed or right skewed. In this type of Skewed Data, Mode> Median > Mean. Learn more>>>
9. What is Data wrangling? What are the different steps involved in it?
Data Wrangling is the process of converting and mapping data from its raw form to another format with the purpose of making it more valuable and appropriate for advance tasks such as Data Analytics and Machine Learning. Learn more>>>
10. What do you mean by Features and Labels in a Dataset?
Features are individual independent variables which acts as the input in the system. Prediction models uses these features to make predictions. New features can also be extracted from old features using a method known as ‘feature engineering’. To make it simple, you can consider one column of your data set to be one feature. Features are also called attributes. And the number of features is dimensions. Learn more>>>
11. What are the differences between Labelled and Unlabelled Data?
Labeled data is a group of samples that have been marked with one or more labels. Labeling typically takes a set of unlabeled data and expands each piece of that unlabeled data with meaningful tags that are informative. Learn more>>>
12. What do you mean by independent and Dependent Variables?
An independent variable is a variable that represents a quantity that is being used in an experiment. The independent variable (sometimes known as the manipulated variable) is the variable whose change isn’t affected by any other variable in the experiment. Learn more>>>
13. What do you mean by Noise in given Dataset and How can you remove Noise in Dataset?
Noise is unwanted data items, features or records which don’t help in explaining the feature itself, or the relationship between feature & target. Noise often causes the algorithms to miss out patterns in the data. Noisy data is meaningless data. Learn more>>>
14. What do you mean by Law of transformation of Skewed Variables?
Different features in the data set may have values in different ranges. For example, in an employee data set, the range of salary feature may lie from thousands to lakhs but the range of values of age feature will be in 20- 60. That means a column is more weighted compared to other. Learn more>>>
15. What do you mean by Imputer?
Imputation is the process of replacing missing data with substituted values. It substitutes missing values by the mean or median of the remaining values. Learn more>>>
16. What are the differences between Mean, Median, Mode? How these are helpful to deal with the missing values in the given dataset?
Mean is the average of the Dataset. It is the ratio of Sum of total observations to the Total number of observations. Median is a middle value of the Dataset. If the total number of observations in the Dataset is odd in number, then median is the middle most value or observation. If the total number of observations in the dataset are even in number, then the median is given by the average of the middle two values of the dataset. Learn more>>>
17. What do you mean by Dummy Variable? Where it is used in Machine Learning?
If there are n number of categories in categorical attribute, n new attributes will be created. These attributes created are called Dummy Variables. These dummy variables will be created with one hot encoding and each attribute will have value either 0 or 1, representing presence or absence of that attribute. Learn more>>>
18. What is the importance of Mean, Variance, Standard Deviation in identifying details of particular feature in Dataset? How do you calculate it?
Mean is average of a given set of data. Variance is the sum of squares of differences between all numbers and means. Standard Deviation is square root of variance. It is a measure of the extent to which data varies from the mean. Learn more>>>
19. What do you mean by Binning in Machine Learning? What are the differences between fixed width binning and Adoptive binning?
Data binning, bucketing is a data pre-processing method used to minimize the effects of observation errors. Binning is the process of transforming numerical variables into categorical counterparts. Binning improves accuracy of the predictive models by reducing the noise or non-linearity in the dataset. Learn more>>>
20. What is Feature Scaling?
Feature Scaling or Standardization: It is a step of Data Preprocessing which is applied to independent variables or features of data. It helps to normalize the data within a certain range. It also helps in speeding up the calculations in an algorithm. Learn more>>>
21. Explain in detail about Normalization and Standardization?
Standardization is the process of rescaling the features so that they’ll have the properties of a Gaussian distribution with where μ is the mean and σ is the standard deviation from the mean; standard scores (also called z scores) of the samples are calculated as follows: Learn more>>>
22. How to deal with imbalanced dataset in Machine Learning?
There are 5 different methods for dealing with imbalanced datasets:Change the performance metric, Change the algorithm, Over sample minority class,Under sample majority class, Generate synthetic samples. Learn more>>>
23. What is the difference between Training dataset, Testing Dataset, Validation dataset? What is the Common Ratio?
Training Dataset: The sample of data used to fit the model. The actual dataset that we use to train the model. The model sees and learns from this data. Validation Dataset: The sample of data used to provide an unbiased evaluation of a model fit on the training dataset while tuning model hyperparameters. The evaluation becomes more biased as skill on the validation dataset is incorporated into the model configuration. Learn more>>>
24. What do you mean by Fourier Transforms? How can we use in Machine Learning?
Fourier Transforms means converting or decomposes a signal into frequencies. Fourier Transform moves from Time domain to Frequency domain. If we want to move from Frequency domain to Time domain, we can do it by Inverse Fourier Transform. Learn more>>>
25. What is the difference between Feature Selection and Feature Extraction?
Feature selection is the process of choosing precise features, from a features pool. This helps in simplification, regularization and shortening training time. This can be done with various techniques: e.g. Linear Regression, Decision Trees. Learn more>>>
26. Explain Multi collinearity in detail? How to reduce it?
Multicollinearity is a phenomenon in which two or more predictor variables or Independent variables in a regression model are highly correlated, which means that one variable can be linearly predicted from the others with a considerable degree of accuracy. Two variables are perfectly collinear if there is an exact linear relationship between them. Learn more>>>
27. What do you mean by correlation?
Correlation means the extent to which the two variables have a linear relationship with each other. It is a statistical technique which can show how strongly variables are related to each other. It is a scaled version of covariance and values ranges from -1 to +1. Learn more>>>
28. Explain in detail about Covariance?
Covariance is a measure of how changes in one variable are associated with changes in a second variable. Precisely, covariance measures the degree to which two variables are linearly associated. Learn more>>>
29. What do you mean by Curse of Dimensionality? What are the different ways to deal with it?
When the data has too many features, then we want to reduce some of the features in it for easy understanding and execution of the data analysis. This is called Curse of Dimensionality. This can be reduced by Dimensionality Reduction. Learn more>>>
30. Explain different types of Plots that we generally use in Machine Learning?
There are different plots we use in Machine Learning which can be visualized using python. Different plots are listed below. Scatter plot, Box plot, Bar chart, Line plot, Histogram. Learn more>>>
31. Explain in detail about Data Visualizations?
Data visualization is the graphical representation of information and data. By using visual elements like charts, graphs, and maps, data visualization tools provide an accessible way to see and understand trends, outliers, and patterns in data. Learn more>>>
32. What do you mean by Matplotlib?
Matplotlib is an amazing visualization library in Python for 2D plots of arrays. Matplotlib is a multi-platform data visualization library built on NumPy arrays and designed to work with the broader SciPy stack. Learn more>>>
33. Explain about Bar chart?
A bar plot is a plot that presents categorical data with rectangular bars with lengths proportional to the values that they represent. A bar plot shows comparisons among discrete categories. One axis of the plot shows the specific categories being compared, and the other axis represents a measured value. Learn more>>>
34. Explain in detail about Line Chart?
The line chart is represented by a series of datapoints connected with a straight line. Line charts are most often used to visualize data that changes over time. Learn more>>>
35. Explain in detail about Histogram?
A histogram is a plot of the frequency distribution of numeric array by splitting it to small equal-sized bins. Learn more>>>
36. What do you mean by Box Plot?
A boxplot is a standardized way of displaying the distribution of data based on a five numbered summary (“minimum”, first quartile (Q1), median, third quartile (Q3), and “maximum”). It can tell you about your outliers and what their values are. Learn more>>>
37. Explain in detail about Scatter Plot?
A scatter plot, also known as a scatter graph or a scatter chart, is a two-dimensional data visualization that uses dots to represent the values obtained for two different variables – one plotted along the x-axis and the other plotted along the y-axis. Learn more>>>
38. What is Dimensionality Reduction in Machine Learning?
Dimensionality reduction is the process of reducing the number of random variables under consideration, by obtaining a set of principal variables. It can be divided into feature selection and feature extraction. The higher the number of features, the harder it gets to visualize. Learn more>>>
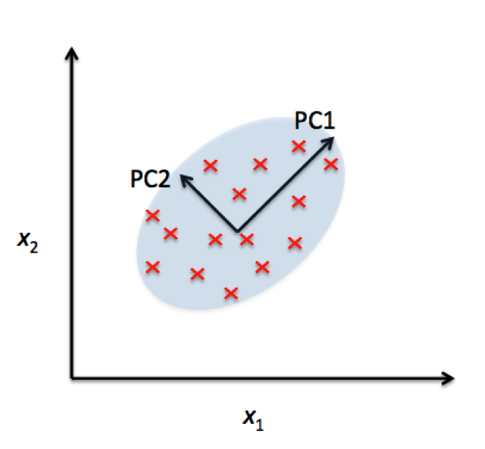
39. What do you mean by Principal Component Analysis?
Principal component analysis is a technique for feature extraction so, it combines our input variables in a specific way, then we can drop the “least important” variables while still retaining the most valuable parts of all of the variables. Learn more>>>
40. What do you mean by Linear Discriminant Analysis?
Linear Discriminant Analysis is a supervised algorithm as it takes the class label into consideration. It is a way to reduce ‘dimensionality’ while at the same time preserving as much of the class discrimination information as possible. Learn more>>>
41. Explain about Eigen values and Eigen Vectors?
Eigenvector—Every vector (list of numbers) has a direction when it is plotted on an XY chart. Eigenvectors are those vectors when a linear transformation (such as multiplying it to a scalar) is performed on them then their direction does not change. This attribute of Eigenvectors makes them very valuable as I will explain in this article. Learn more>>>
42. What do you mean by Singular Value Decomposition?
The Singular-Value Decomposition, or SVD for short, is a matrix decomposition method for reducing a matrix to its constituent parts in order to make certain subsequent matrix calculations simpler. Learn more>>>
43. What are the Pros and cons of the PCA?
Removes Correlated Features: In a real-world scenario, this is very common that you get thousands of features in your dataset. You cannot run your algorithm on all the features as it will reduce the performance of your algorithm and it will not be easy to visualize that many features in any kind of graph. So, you MUST reduce the number of features in your dataset. Learn more>>>
44. What are the differences between PCA and LDA?
Both LDA and PCA are linear transformation techniques: LDA is a supervised whereas PCA is unsupervised and ignores class labels.We can picture PCA as a technique that finds the directions of maximal variance: Learn more>>>
45. What do you mean by Multi-Dimensional Scaling (MDS)?
Multidimensional scaling is a visual representation of distances or dissimilarities between sets of objects. “Objects” can be colors, faces, map coordinates. MDS does finds set of vectors in p-dimensional space such that the matrix of Euclidean distances among them corresponds as closely as possible to some function of the input matrix according to a criterion function called stress. Learn more>>>
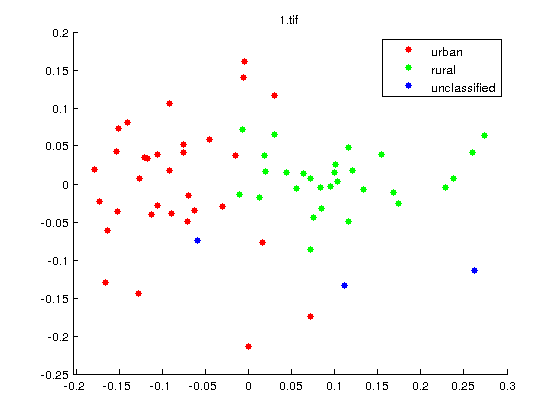
46. What is the difference between Multi-Dimensional Scaling and Principal Component Analysis?
Principal Component Analysis: The input to PCA is the original vectors in n-dimensional space.And the data are projected onto the directions in the data with the most variance. Hence the “spread” of the data is roughly conserved as the dimensionality decreases. Learn more>>>
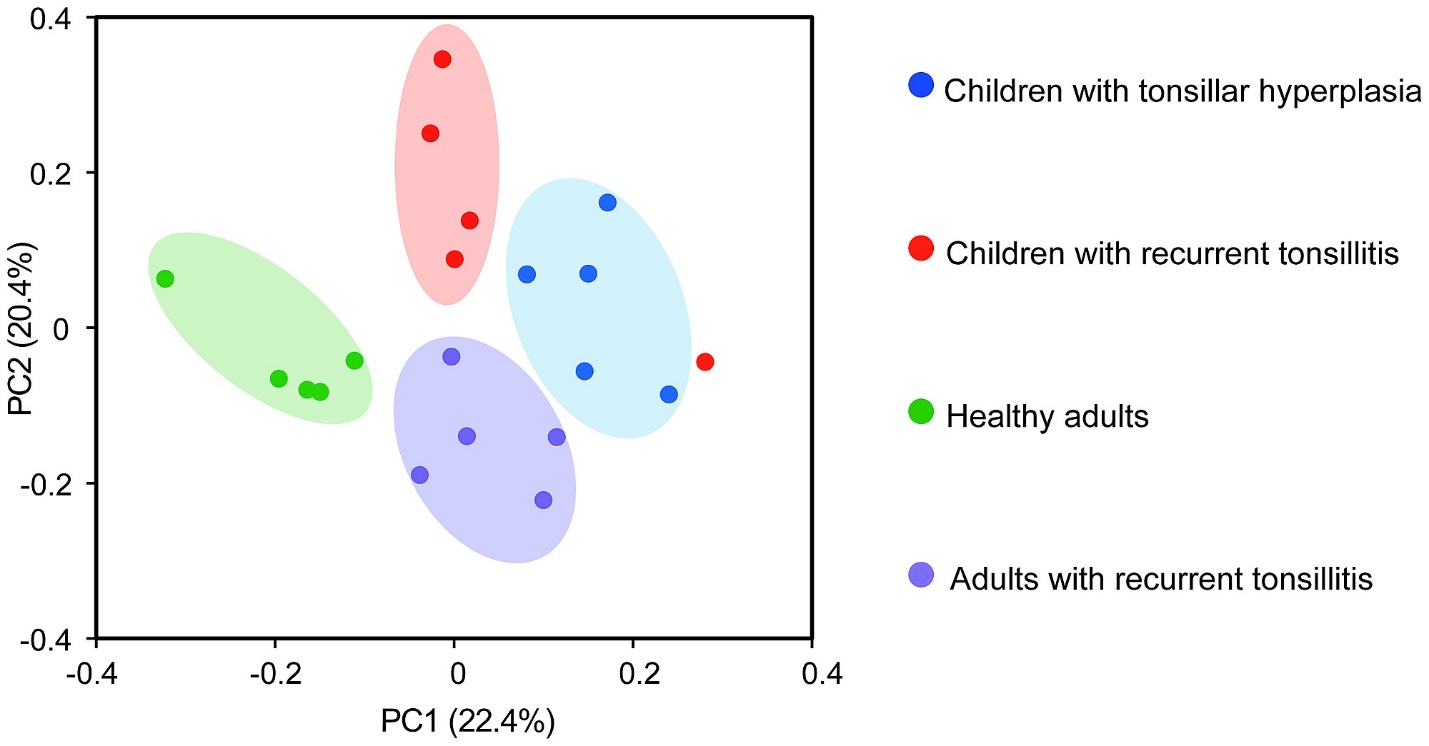
47. What do you mean by Principal coordinate analysis?
Principal Coordinates Analysis (PCoA,) is a method to explore and to visualize similarities or dissimilarities of data. It starts with a similarity matrix or dissimilarity matrix and assigns for each item a location in a low-dimensional space. Learn more>>>