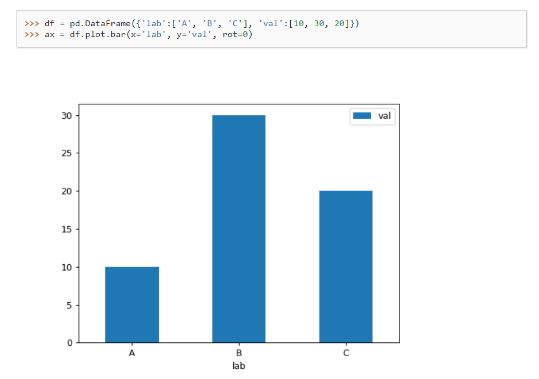
Explain about Bar chart?
A bar plot is a plot that presents categorical data with rectangular bars with lengths proportional to the values that they represent. A bar plot shows comparisons among discrete categories. One axis of the plot shows the specific categories being compared, and the other axis represents a measured value.

Share: