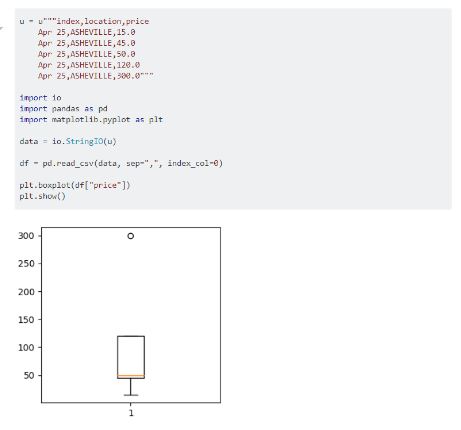
What do you mean by Box Plot?
A boxplot is a standardized way of displaying the distribution of data based on a five numbered summary (“minimum”, first quartile (Q1), median, third quartile (Q3), and “maximum”). It can tell you about your outliers and what their values are. It can also tell you if your data is symmetrical, how tightly your data is grouped, and if and how your data is skewed. It is also called as Whisker Plot.
Share: