Understanding correlation in statistics
In this tutorial, we are going to discuss about correlation.
What is Correlation?
Correlation is a statistical technique that is used to understand the relationship between two variables.
Variables can be a quantitative type or a qualitative type.
- Quantitative represents numerical data
- Qualitative represents categorical data
We can evaluate the correlation between the two variables by using two different methods.
1. Graphical method
2. Mathematical method
let us try to understand both of these two methods
- Graphical method
we will use the scatter plot which is a graphical method to understand the relationship between two variables by visualizing the data patterns.
There are three different types of relationships
- positive relationship
- Negative relationship
- No relationship
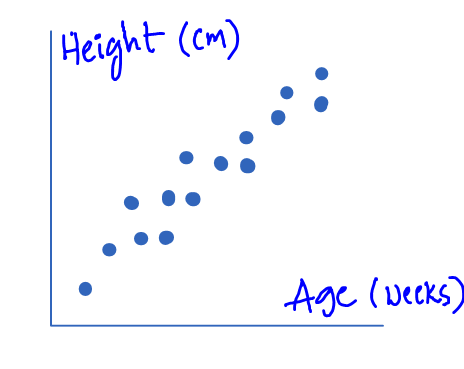
Positive relationship
When the data points which are plotted on scatter plot are inclined towards the positive coordinates, it can be considered as Positive Relation.
If you can take a look at the below scatter plot holds the data X, Y.
- Age in weeks on the x-axis
- Height in cm on the y-axis
The scatter plot clearly shows it is inclined towards the positive direction that a positive relationship.

Negative relationship
When the data points which are plotted on scatter plot are inclined towards the negative coordinates, it can be considered as Negative Relation.
If you can take a look at the below scatterplot which holds the data x, y.
- Age of a car on the x-axis
- Reliability of a car on the y-axis
The scatterplot clearly shows it is in coined towards the negative direction which represents as the age of the car increases the Reliability of the car decreases.
From which we can clearly understand the relationship between these two variables is a negative relationship.

No relationship
When the data points which are plotted on scatter plot are completely scattered across the coordinates, it can be considered as No Relation.
If you can take a look at the below scatter plot that holds the data x, y.
- Pulse rate on the x-axis
- Debate on the y-axis weight on the y-axis
The scatterplot clearly shows it is completely scattered which represents there is no relationship between the two variables.

2. Mathematical method
There are many methods in a mathematical way but you are let me explain to you two important methods which are mentioned below
- Karl Pearson’s correlation coefficient
- Spearman rank correlation coefficient
In mathematical methods we will use a variable that is represented as “r” to understand the degree of variability.
This is generally called as Pearson’s correlation coefficient for the product-moment correlation coefficient.
Here R represents the nature and strength of association.
Characteristics of r :
- The range of R value will be in between -1 and + 1.
- If the sign of the earth value R value is positive it means the relationship is a direct
- If the sign of our value is negative it means the relation is indirect
- When the R value is high the strength of the correlation is high between the two variables.
- When the R value is low the strength of the correlation is low between the two variables.
- If r = Zero this means no association or correlation between the two variables.
- If 0 < r < 0.25 = weak correlation.
- If 0.25 ≤ r < 0.75 = intermediate correlation.
- If 0.75 ≤ r < 1 = strong correlation.
- If r = l = perfect correlation.
- Karl Pearson’s Correlation coefficient
When the given variables are Quantitative in nature, then we would prefer working with Karl Pearson’s Correlation.

2. Spearman Rank Correlation Coefficient
When the given variables are both of Qualitative Ordered in nature, Otherwise one Quantitative Variable & one Qualitative Ordered Variable in nature, then we would prefer working with Spearman Rank Correlation.

It is a non-parametric measure of correlation.
This procedure makes use of the two sets of ranks that may be assigned to the sample values of X and Y.
Procedure:
- Rank the values of X from 1 to n where n is the number of pairs of values of X and Y in the sample.
- Rank the values of Y from 1 to n.
- Compute the value of di for each pair of observations by subtracting the rank of Yi from the rank of Xi.
- Square each di and compute ∑(di)2 which is the sum of the squared values.