What do you mean by Matplotlib?
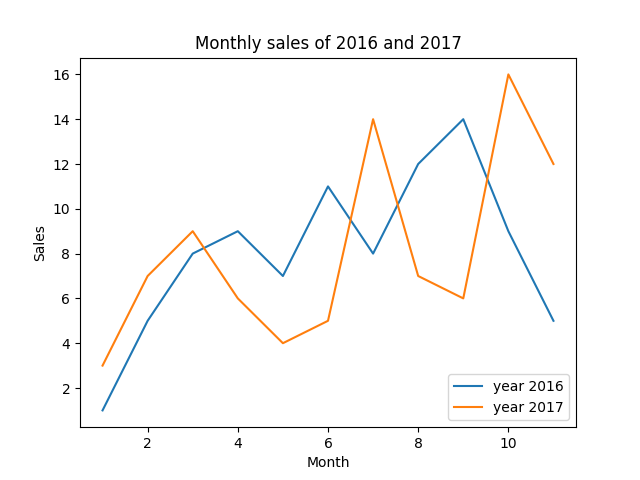
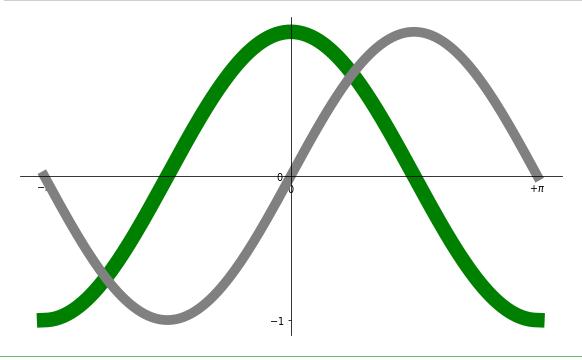
Matplotlib is an amazing visualization library in Python for 2D plots of arrays. Matplotlib is a multi-platform data visualization library built on NumPy arrays and designed to work with the broader SciPy stack.
One of the greatest benefits of visualization is that it allows us visual access to huge amounts of data in easily digestible visuals. Matplotlib consists of several plots like line, bar, scatter, histogram etc.
Line plot :
# importing matplotlib module

from matplotlib import pyplot as plt


# x-axis values

x = [5, 2, 9, 4, 7]


# Y-axis values

y = [10, 5, 8, 4, 2]


# Function to plot

plt.plot(x,y)


# function to show the plot

plt.show()
Bar plot :
# importing matplotlib module

from matplotlib import pyplot as plt


# x-axis values

x = [5, 2, 9, 4, 7]


# Y-axis values

y = [10, 5, 8, 4, 2]


# Function to plot the bar

plt.bar(x,y)


# function to show the plot

plt.show()
Histogram :
# importing matplotlib module

from matplotlib import pyplot as plt


# Y-axis values

y = [10, 5, 8, 4, 2]


# Function to plot histogram

plt.hist(y)


# Function to show the plot

plt.show()
Scatter Plot :
# importing matplotlib module

from matplotlib import pyplot as plt


# x-axis values

x = [5, 2, 9, 4, 7]


# Y-axis values

y = [10, 5, 8, 4, 2]


# Function to plot scatter

plt.scatter(x, y)


# function to show the plot

plt.show()
Share:


