
Boost Your Model Performance by Feature Transformation and Scaling Techniques
Why do we need Feature Transformation and Scaling?
Sometimes, we have datasets where different columns have different units –like, we have columns with income ranging from 20,000 to 100,000, and even more; while an age column ranging from 0 to 100. Thus, Income is about 1,000 times bigger than age.
When we feed these features to the model as it is, there is every chance that the income will influence the result more due to its larger value. So, to give importance to both Age, and Income, we need feature scaling.
In most examples of machine learning models, you might have observed either the Standard Scaler or MinMax Scaler. However, the powerful sklearn library offers many other feature transformations scaling techniques as well, which we can influence depending on the data we are dealing with.
Let us learn them one by one with Python code.
We will work with a simple dataframe:
import pandas as pd
import numpy as np
import matplotlib.pyplot as plt
%matplotlib inline
df = pd.DataFrame({
'Income': [15000, 1800, 120000, 10000],
'Age': [25, 18, 42, 51],
'Department': ['HR','Legal','Marketing','Management']
})
One thing we need to consider is that we cannot scale non-numeric values.
For that, we should create a copy of our dataframe and store the numerical feature names in a list, and their values as well:
df_scaled = df.copy()
col_names = ['Income', 'Age']
features = df_scaled[col_names]
1. MinMax Scaler
The MinMax scaler is simple scalers to understand. It scales all the data between 0 and 1. The formula for calculating the scaled value is-
x_scaled = (x – x_min)/(x_max – x_min)
However (0, 1) is the default range, we can define our range of max and min values. How to implement the MinMax scaler?
- We need to import it
from sklearn.preprocessing import MinMaxScaler
scaler = MinMaxScaler()
- Apply it on the values of the features:
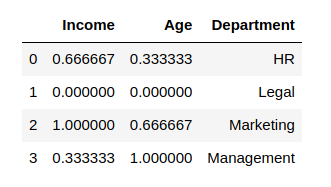
df_scaled[col_names] = scaler.fit_transform(features.values)
Output of scaled values:
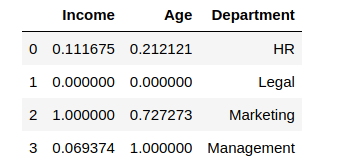
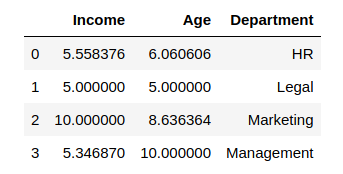
The minimum value among the columns converted to 0, and the maximum value was changed to 1, with other values in between. Let us consider the range to be (5, 10)
from sklearn.preprocessing import MinMaxScaler
scaler = MinMaxScaler(feature_range=(5, 10))
df_scaled[col_names] = scaler.fit_transform(features.values)
df_scaled
Output looks like:
2. Standard Scaler
The Standard Scaler is also another popular scaler that is very easy to understand and apply.
For each feature, the Standard Scaler scales the values in such a way that the mean is 0 and the standard deviation is 1.
x_scaled = x – mean/std_dev
Standard Scaler assumes that the distribution of the variable is normal. In case if the variables are not normally distributed, we
- either choose a different scaler
- or first, change the variables to a normal distribution and then apply this scaler
The standard scaler is much similar to applying a min-max scaler. We first need to import StandardScaler and then use it to transform our variable.
from sklearn.preprocessing
import StandardScalerscaler = StandardScaler()
df_scaled[col_names] = scaler.fit_transform(features.values)
df_scaled
The output after implementing the scaler to our data:
![]()
Now see the mean and standard deviation of both the columns by using a describe() function on df_scaled
df_scaled.describe()
Output:
![]()
You can see that the values are not exactly, but very close to 0. This is due to the numerical precision of floating-point numbers in Python.
3. MaxAbsScaler
The MaxAbs scaler considers the absolute maximum value of each column and divides each value in the column by the maximum value.
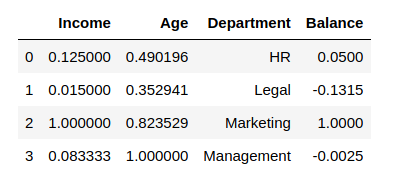
Therefore, it first takes the absolute value of each value in the column and then takes the maximum value out of those. This method scales the data between the range [-1, 1]. To see how it works, we will add another column called ‘Balance” which contains negative values:
df["Balance"] = [100.0, -263.0, 2000.0, -5.0]
from sklearn.preprocessing import MaxAbsScaler
scaler = MaxAbsScaler()
df_scaled[col_names] = scaler.fit_transform(features.values)
df_scaled
Output:
To confirm that the MaxAbs Scaler works as expected by executing the maximum values of each column before we scaled it:
df["Income"].max(), df["Age"].max(), df['Balance'].max()
Output:
(120000, 51, 2000.0)
Thus, we can see that
- each value in the Income column is divided by 120000
- each value in the Age column is divided by 51
- each value in the Balance column is divided by 2000
4. Robust Scaler
If you can observe the scalers we used till now, each of them was using values like the mean, maximum and minimum values of the columns. All these values are sensitive to outliers. If there are too many outliers in the data, they will definitely affect the mean and the max value or the min value. Thus, even if we scale this data using the above methods, we may not be sure a balanced data with a normal distribution.
The Robust Scaler, as the name proposes is not sensitive to outliers. This scaler-
- removes the median from the data
- scales the data by the InterQuartileRange(IQR)
The interquartile range can be defined as-
IQR = Q3 – Q1
Thus, the formula would be:
x_scaled = (x – Q1)/(Q3 – Q1)
This is the default range, however we can define our own range if we want to. Now let us see how can we work with the Robust Scaler in python:
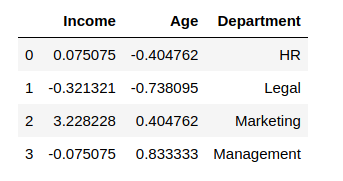
from sklearn.preprocessing import RobustScaler
scaler = RobustScaler()
df_scaled[col_names] = scaler.fit_transform(features.values)
df_scaled
Output:
5. Quantile Transformer Scaler
One of the most exciting feature transformation techniques is the Quantile Transformer Scaler that converts the variable distribution to a normal distribution and scales it accordingly. Since it makes the variable normally distributed, it also deals with the outliers. Here are a few points regarding the Quantile Transformer Scaler:
- It calculates the cumulative distribution function of the variable
- It uses this cdf to map the values to a normal distribution
- Maps the obtained values to the desired output distribution using the related quantile function
It is finest to use this for non-linear data. Below is the code for using the Quantile Transformer:
from sklearn.preprocessing
import QuantileTransformerscaler = QuantileTransformer()
df_scaled[col_names] = scaler.fit_transform(features.values)
df_scaled
Output:
The effects of both the RobustScaler and the QuantileTransformer can be seen on a larger dataset instead of one with 4 rows. Thus, it is recommended you to take up a larger dataset and try these Scalers on their columns to fully understand the changes to the data.